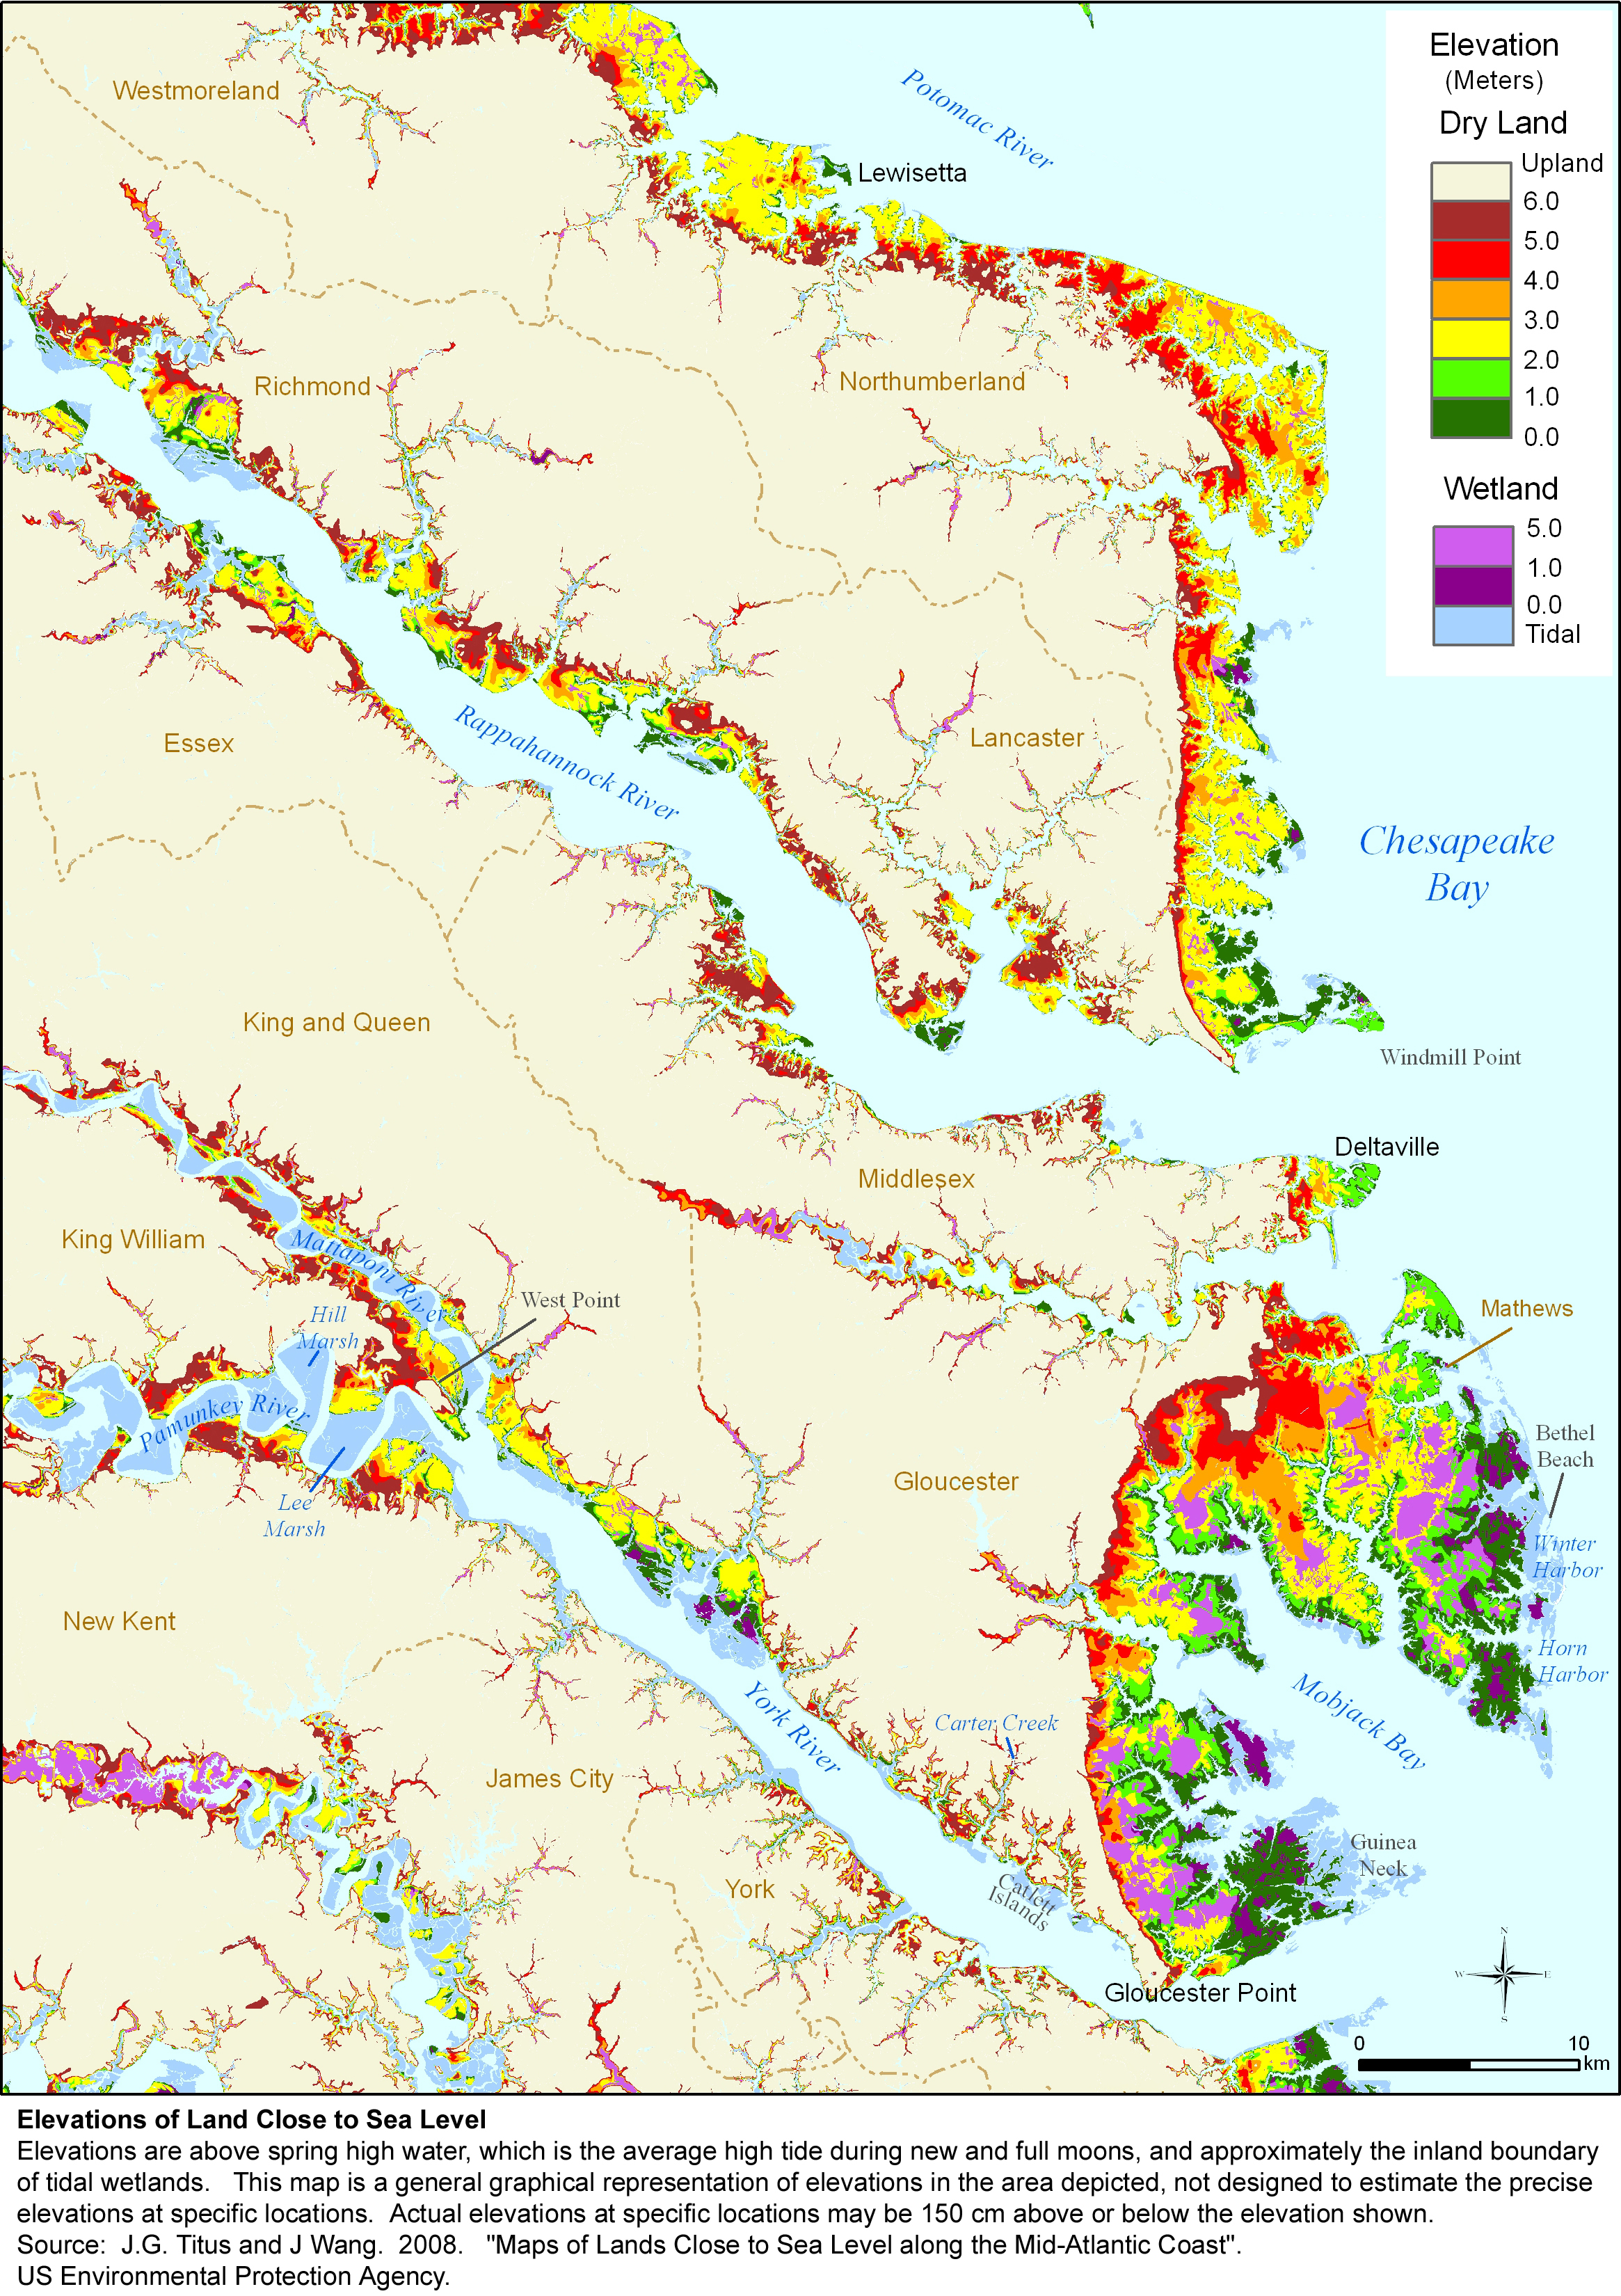
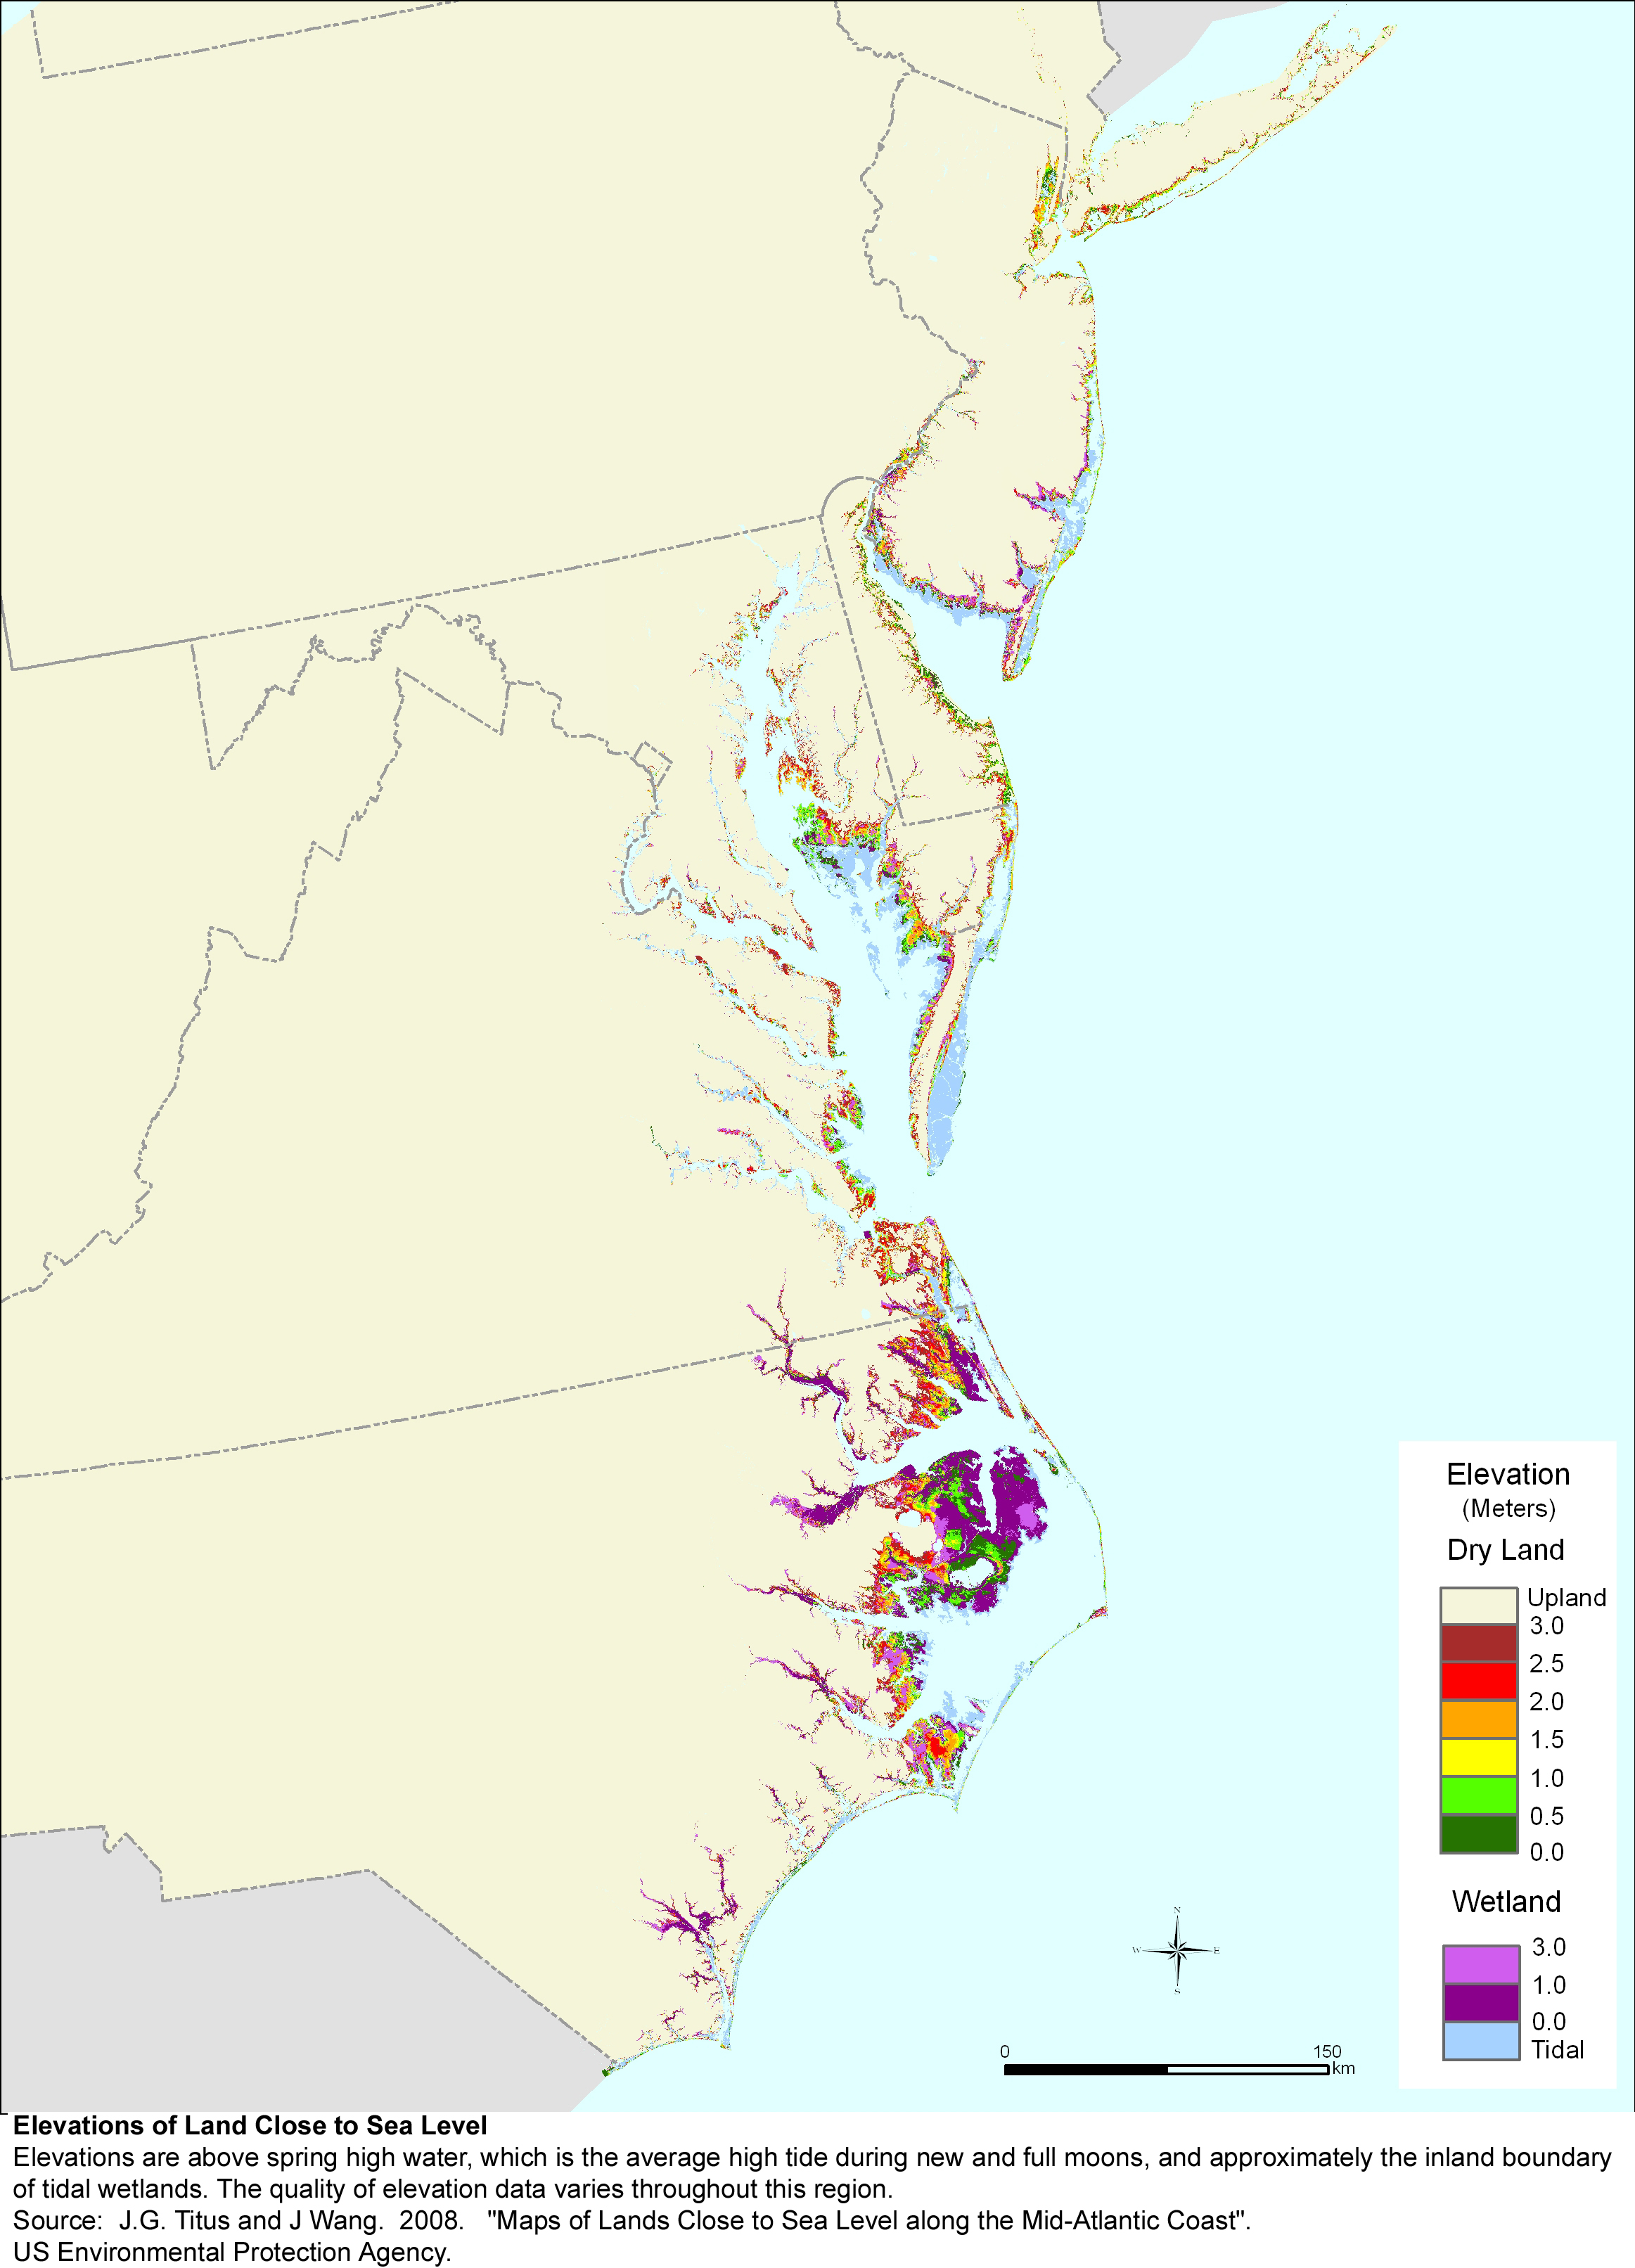
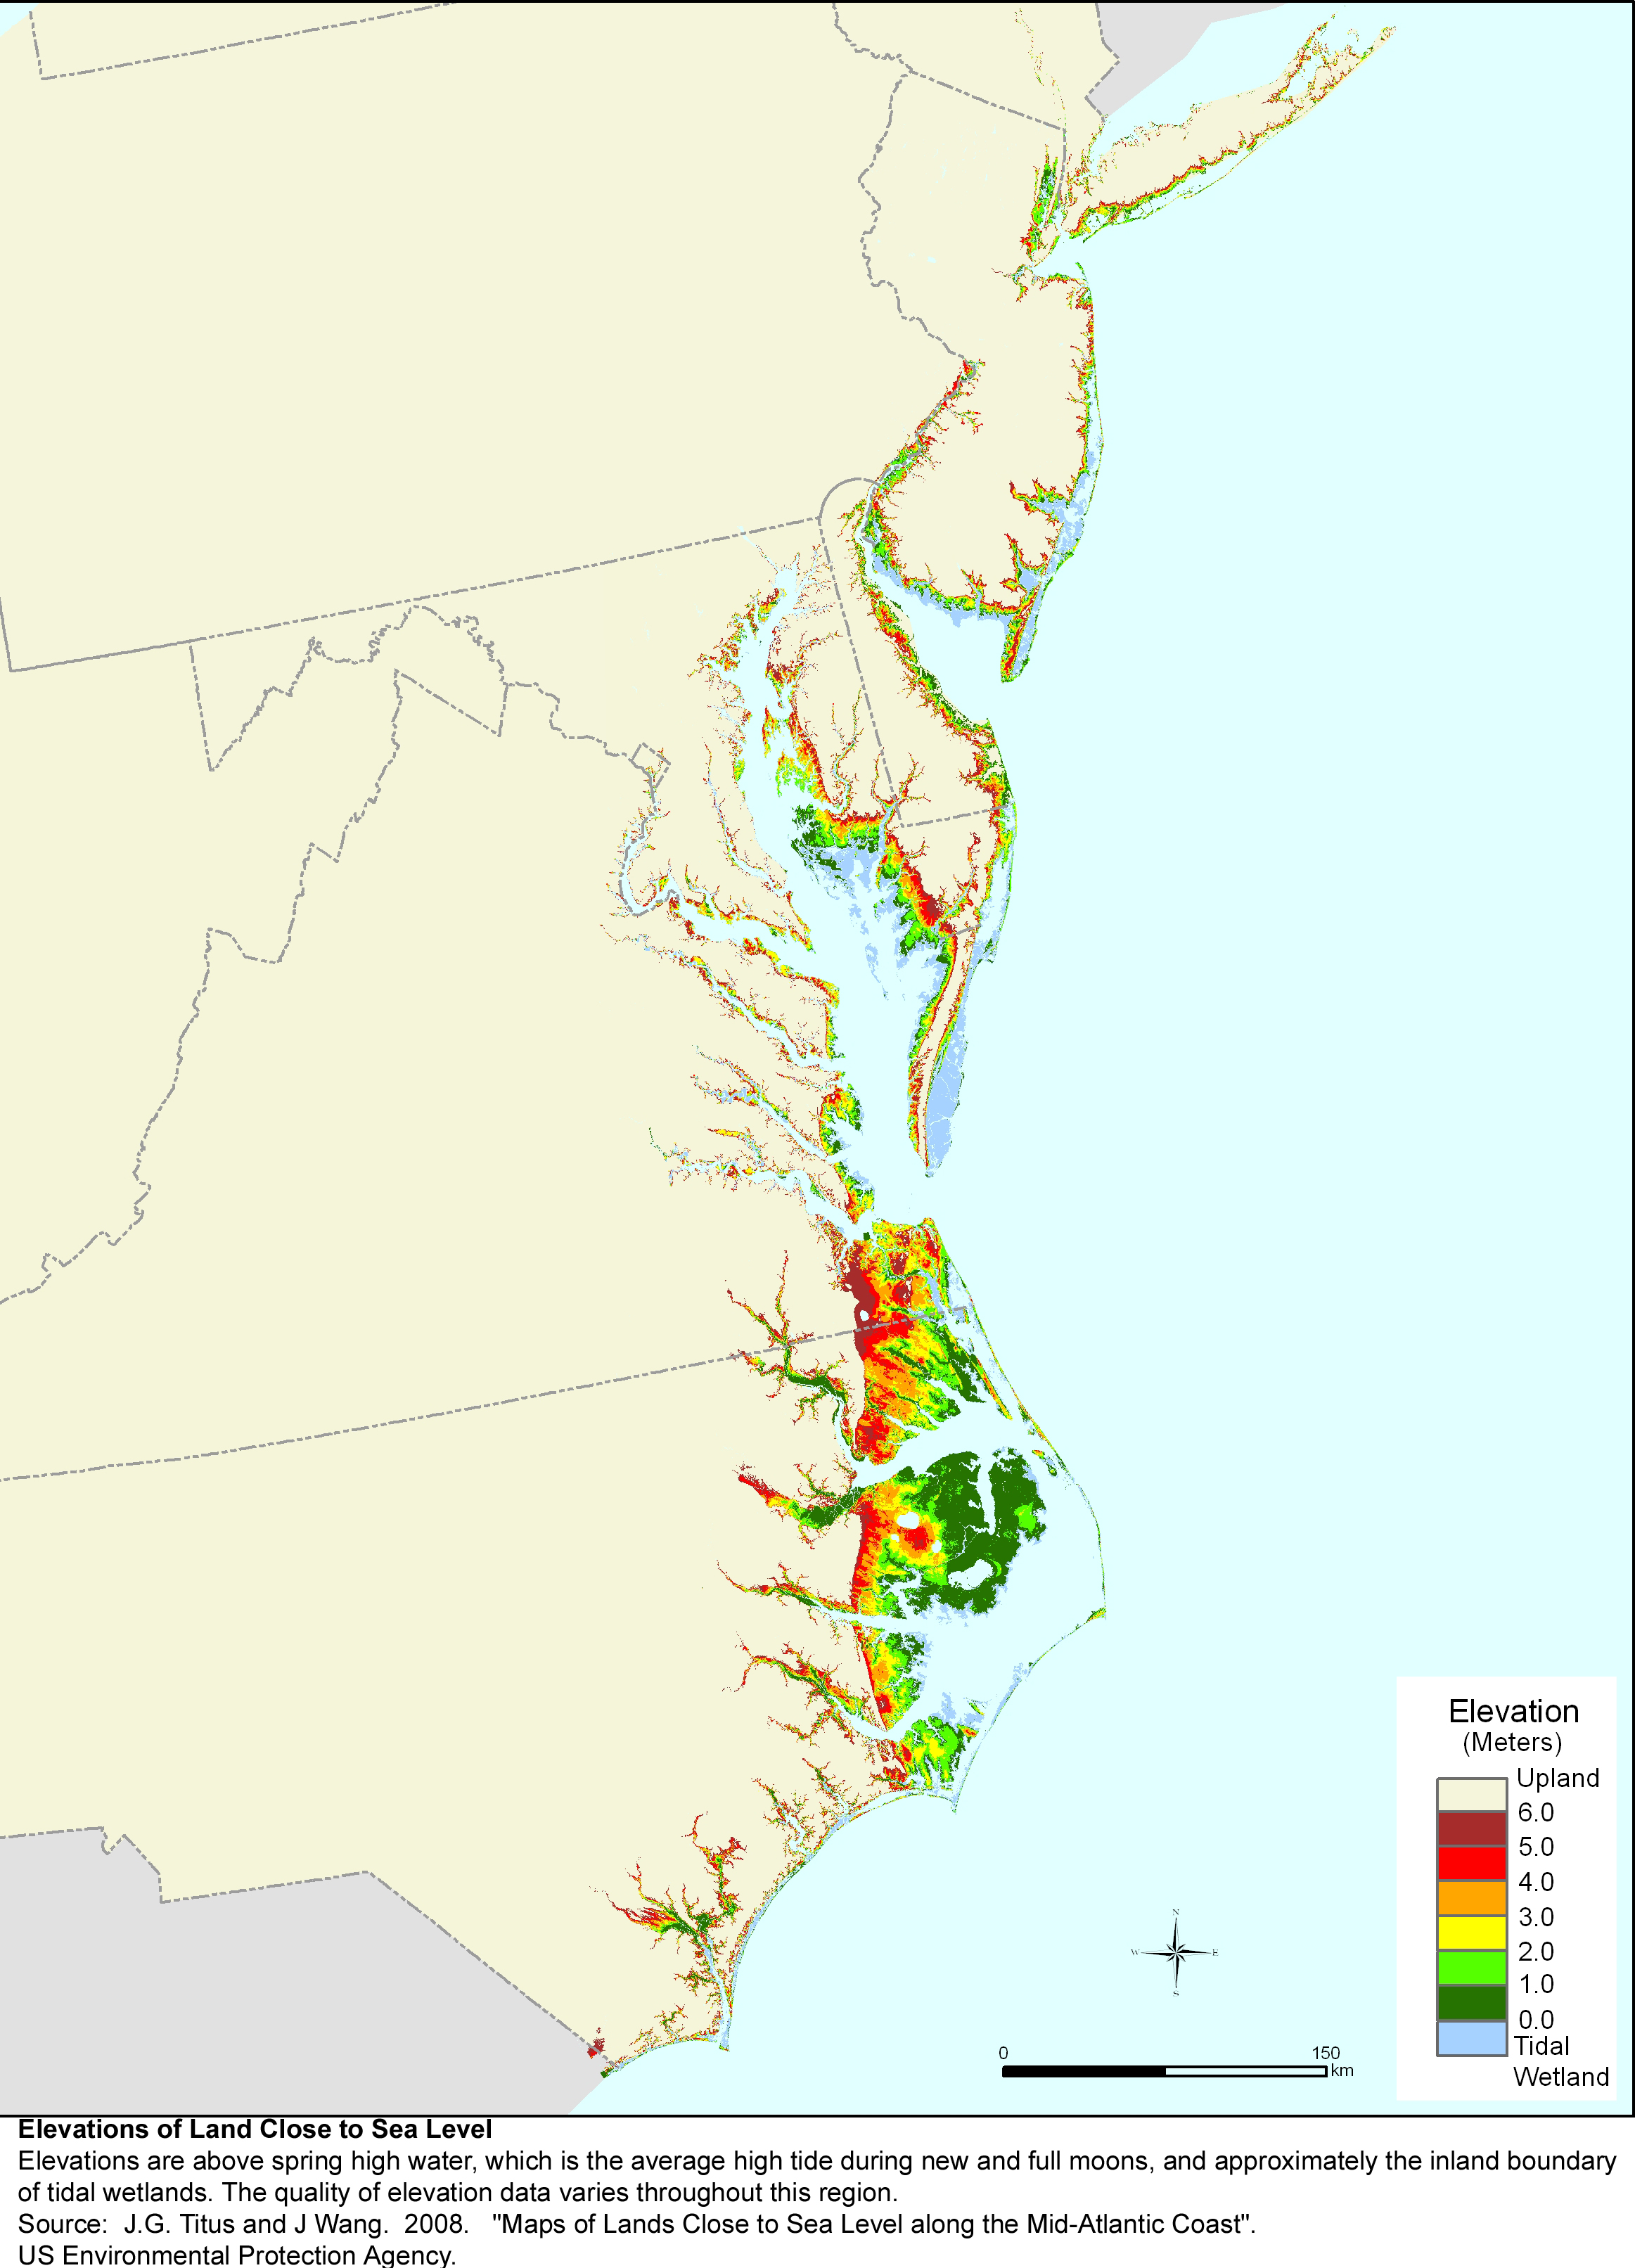
Maps depicting tides, sea level, and rate of sea level rise
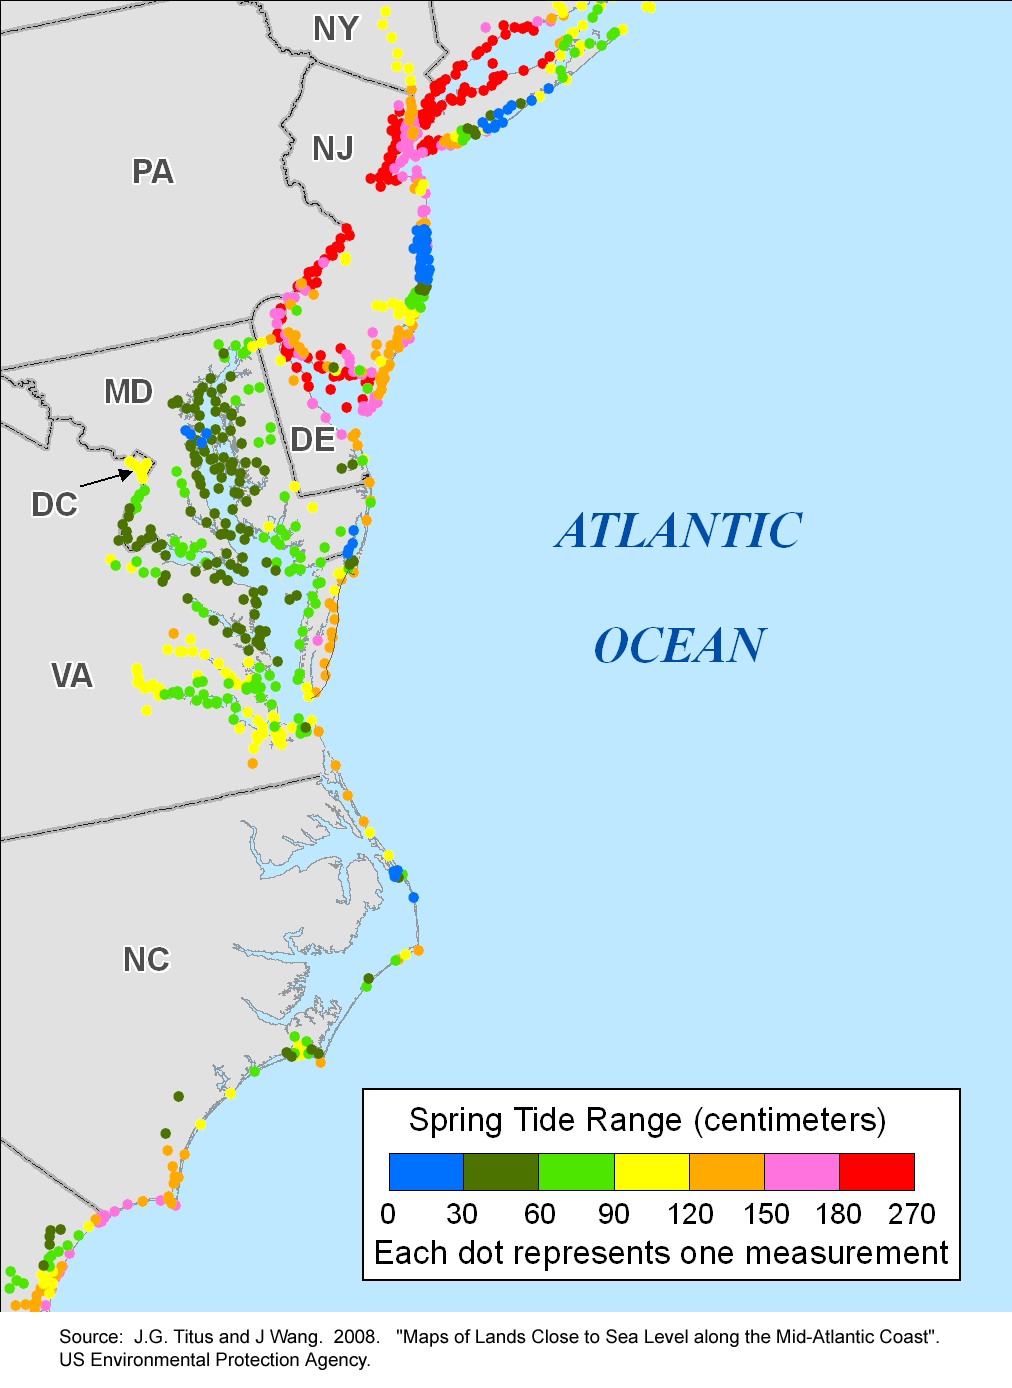
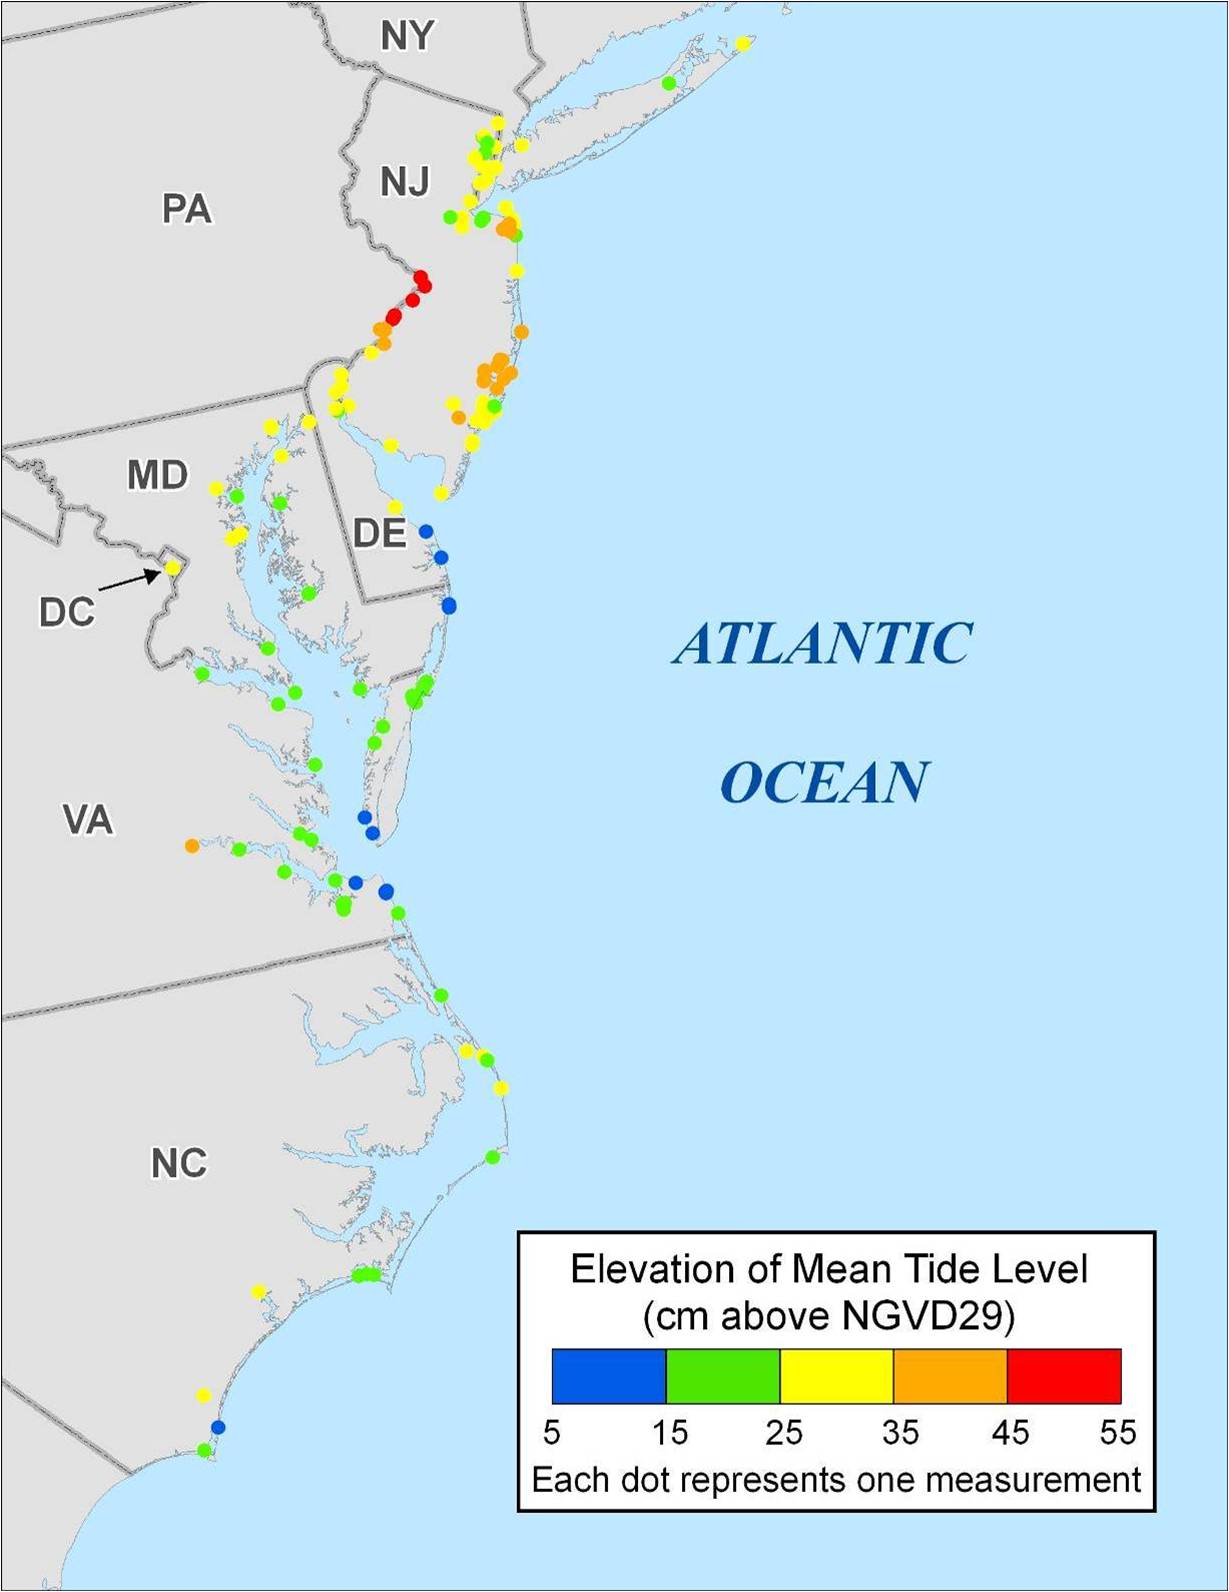
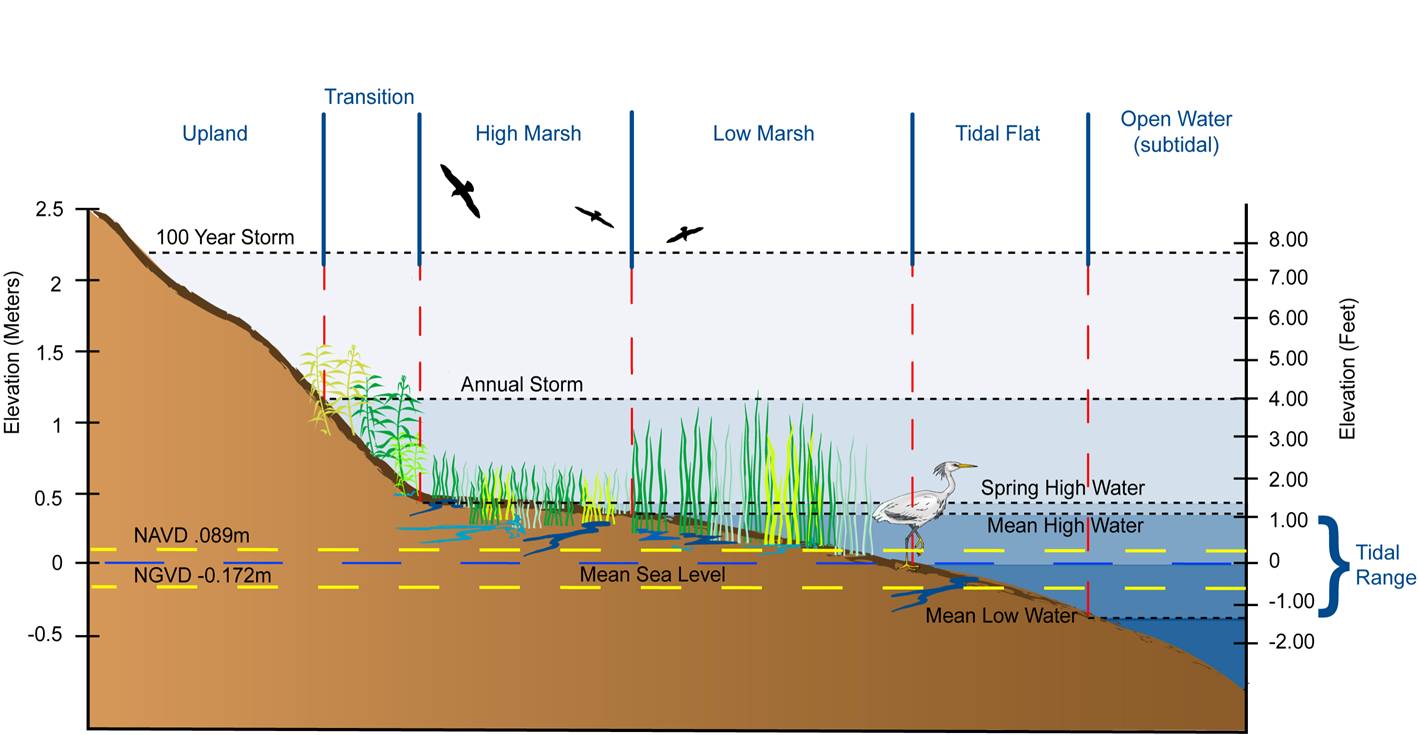
The maps on this page relate to water levels, rather than land elevations. The first maps shows the spring tide range at varuous locations, according to the tide tables that NOAA publishes to allow mariners and others to predict the time and heights of low and high tides. You may have noticed that the maps on this site provide elevations relative to spring high tide, that is, the upper edge of tidal wetlands, unlike most topographic maps, which provide elevations relative to an official reference elevation such as the National Atlantic Vertical Datum. The send map shows the elevations of mean tide level (approxinately mean sea level to the reference elevation used on most USGS printed maps. The data sets for both of these maps were used to express elevations relative to spring high water. The last figure provides additional detail on the relationships of all these elevations.
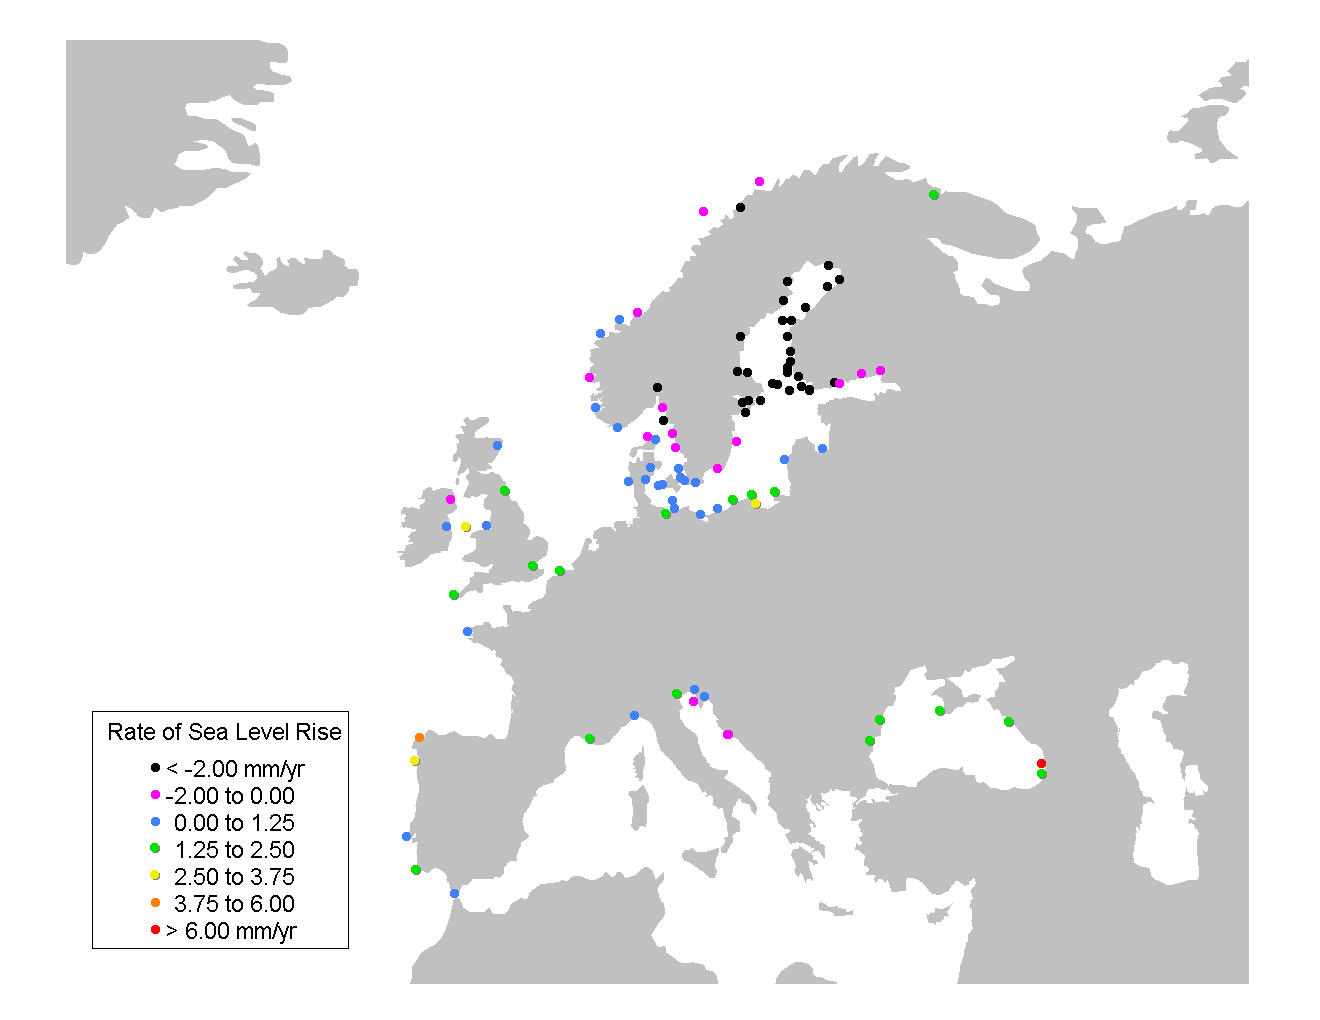
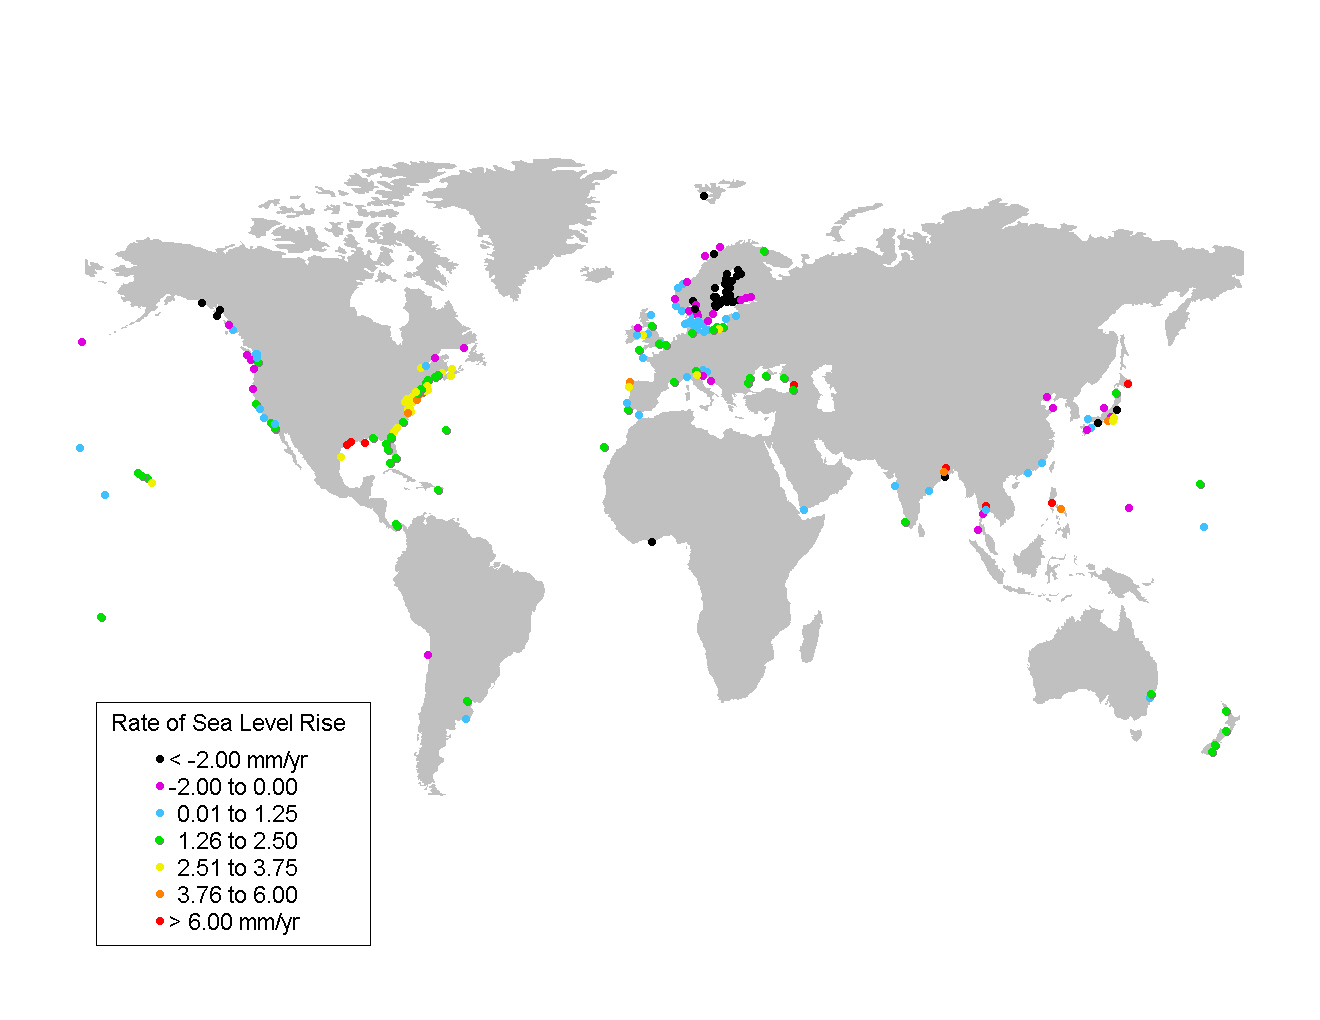
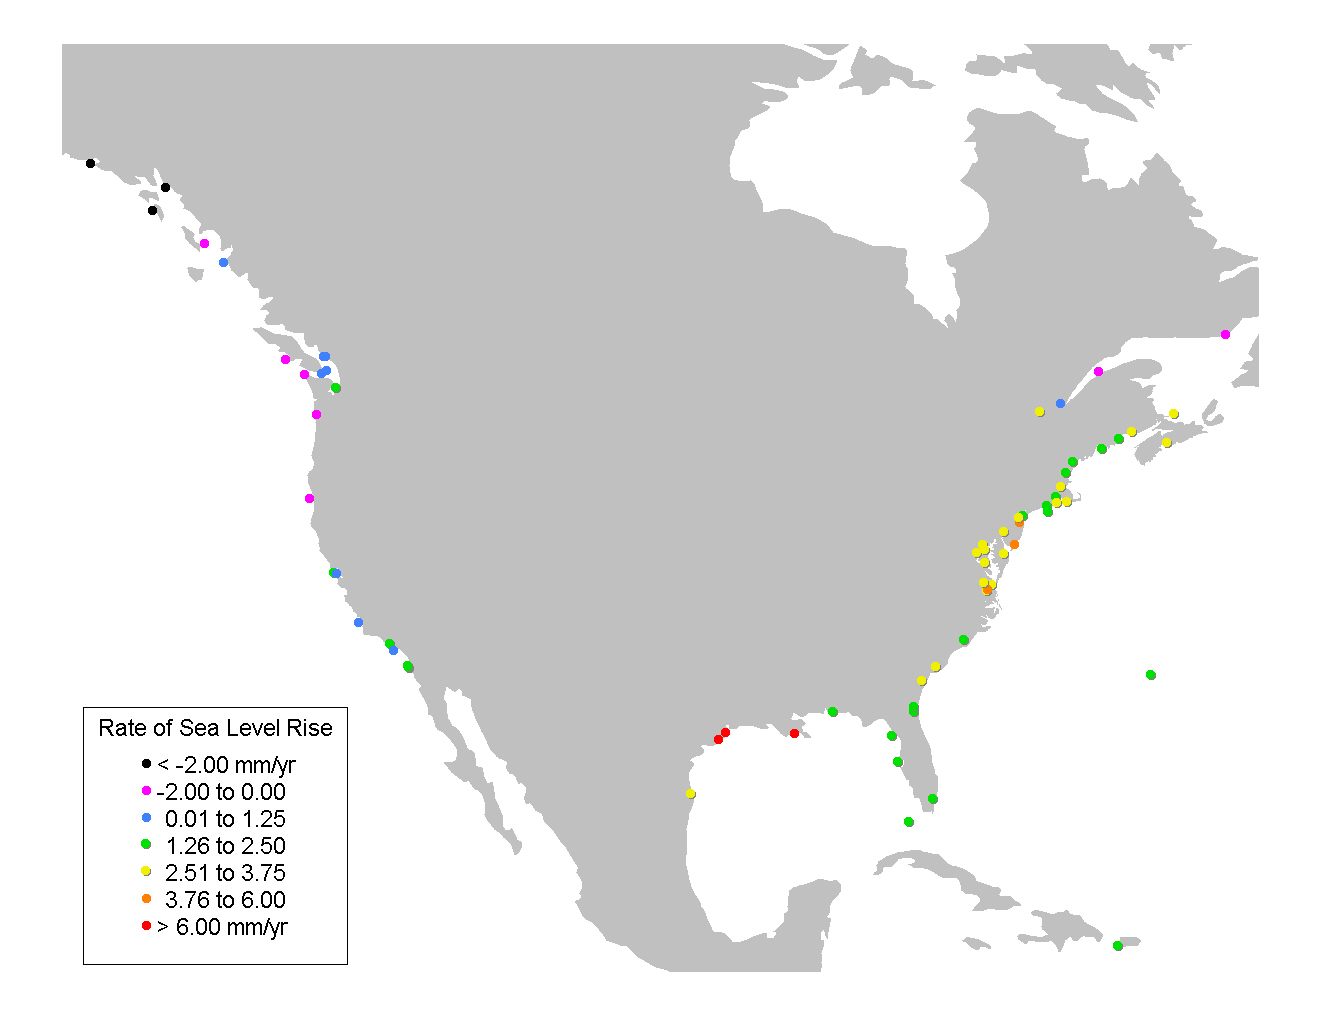
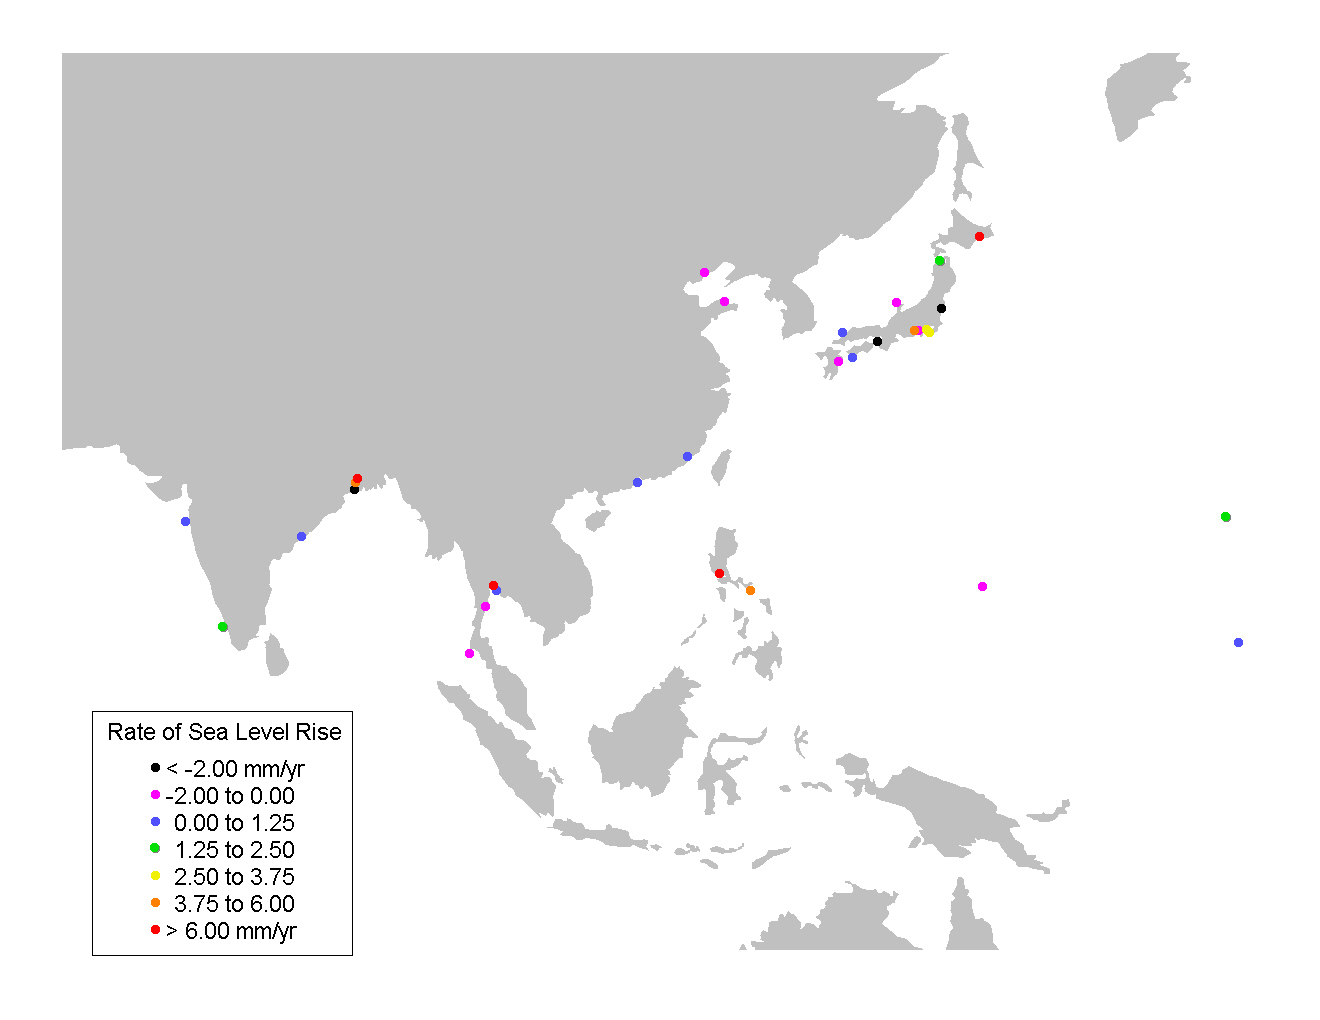
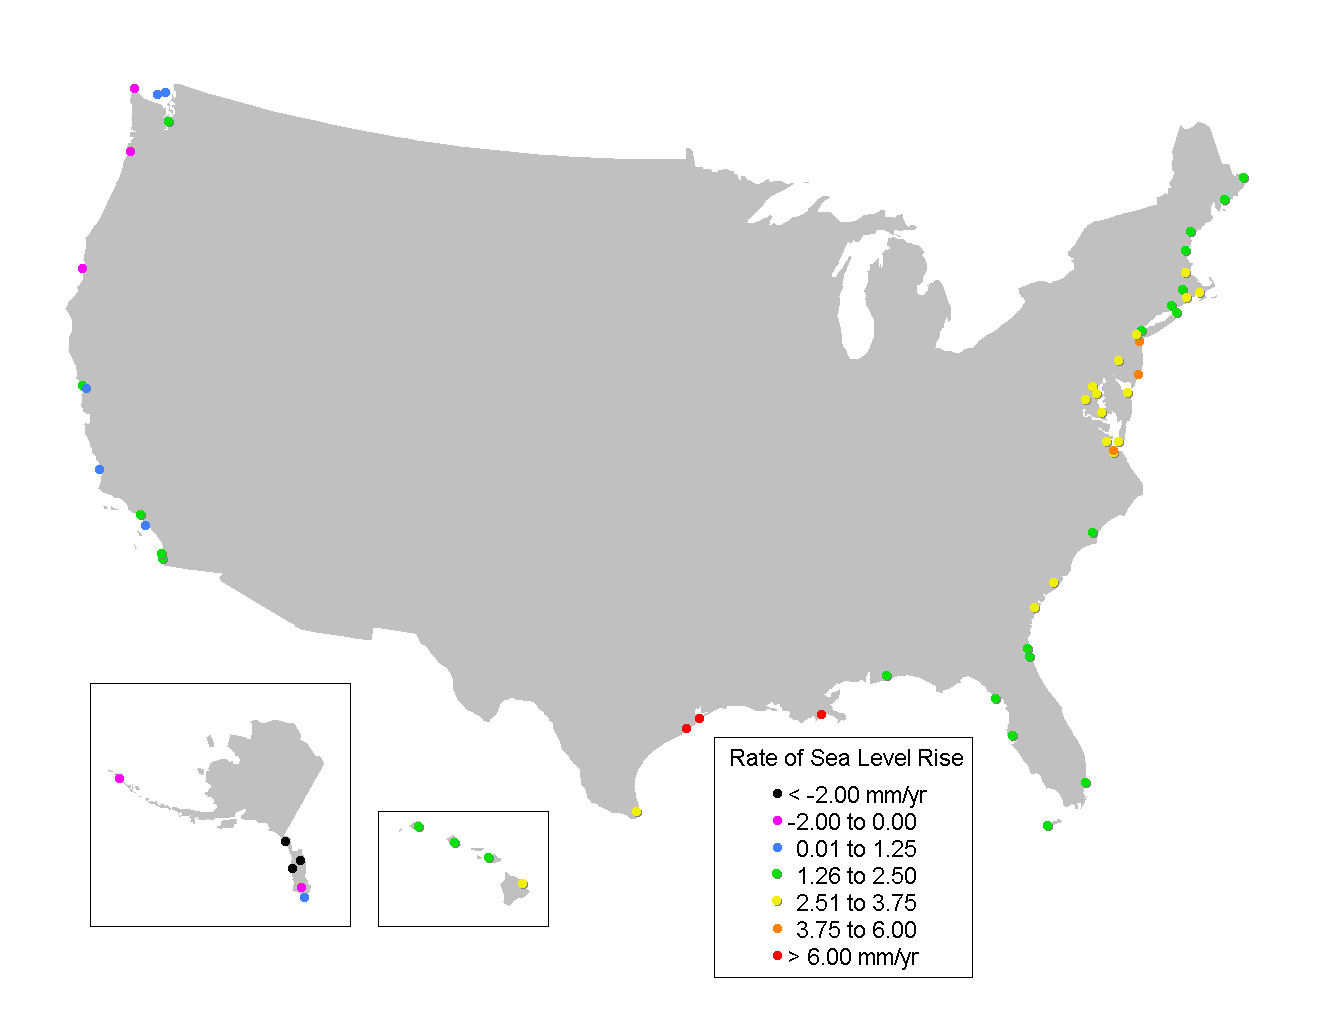
The other maps show the rate of sea level rise according to the regressio coefficients published by the Permanent Service for Mean Sea level.
|
|
|
|
|
|
|
|
|
|
|
|
|
|
|
|