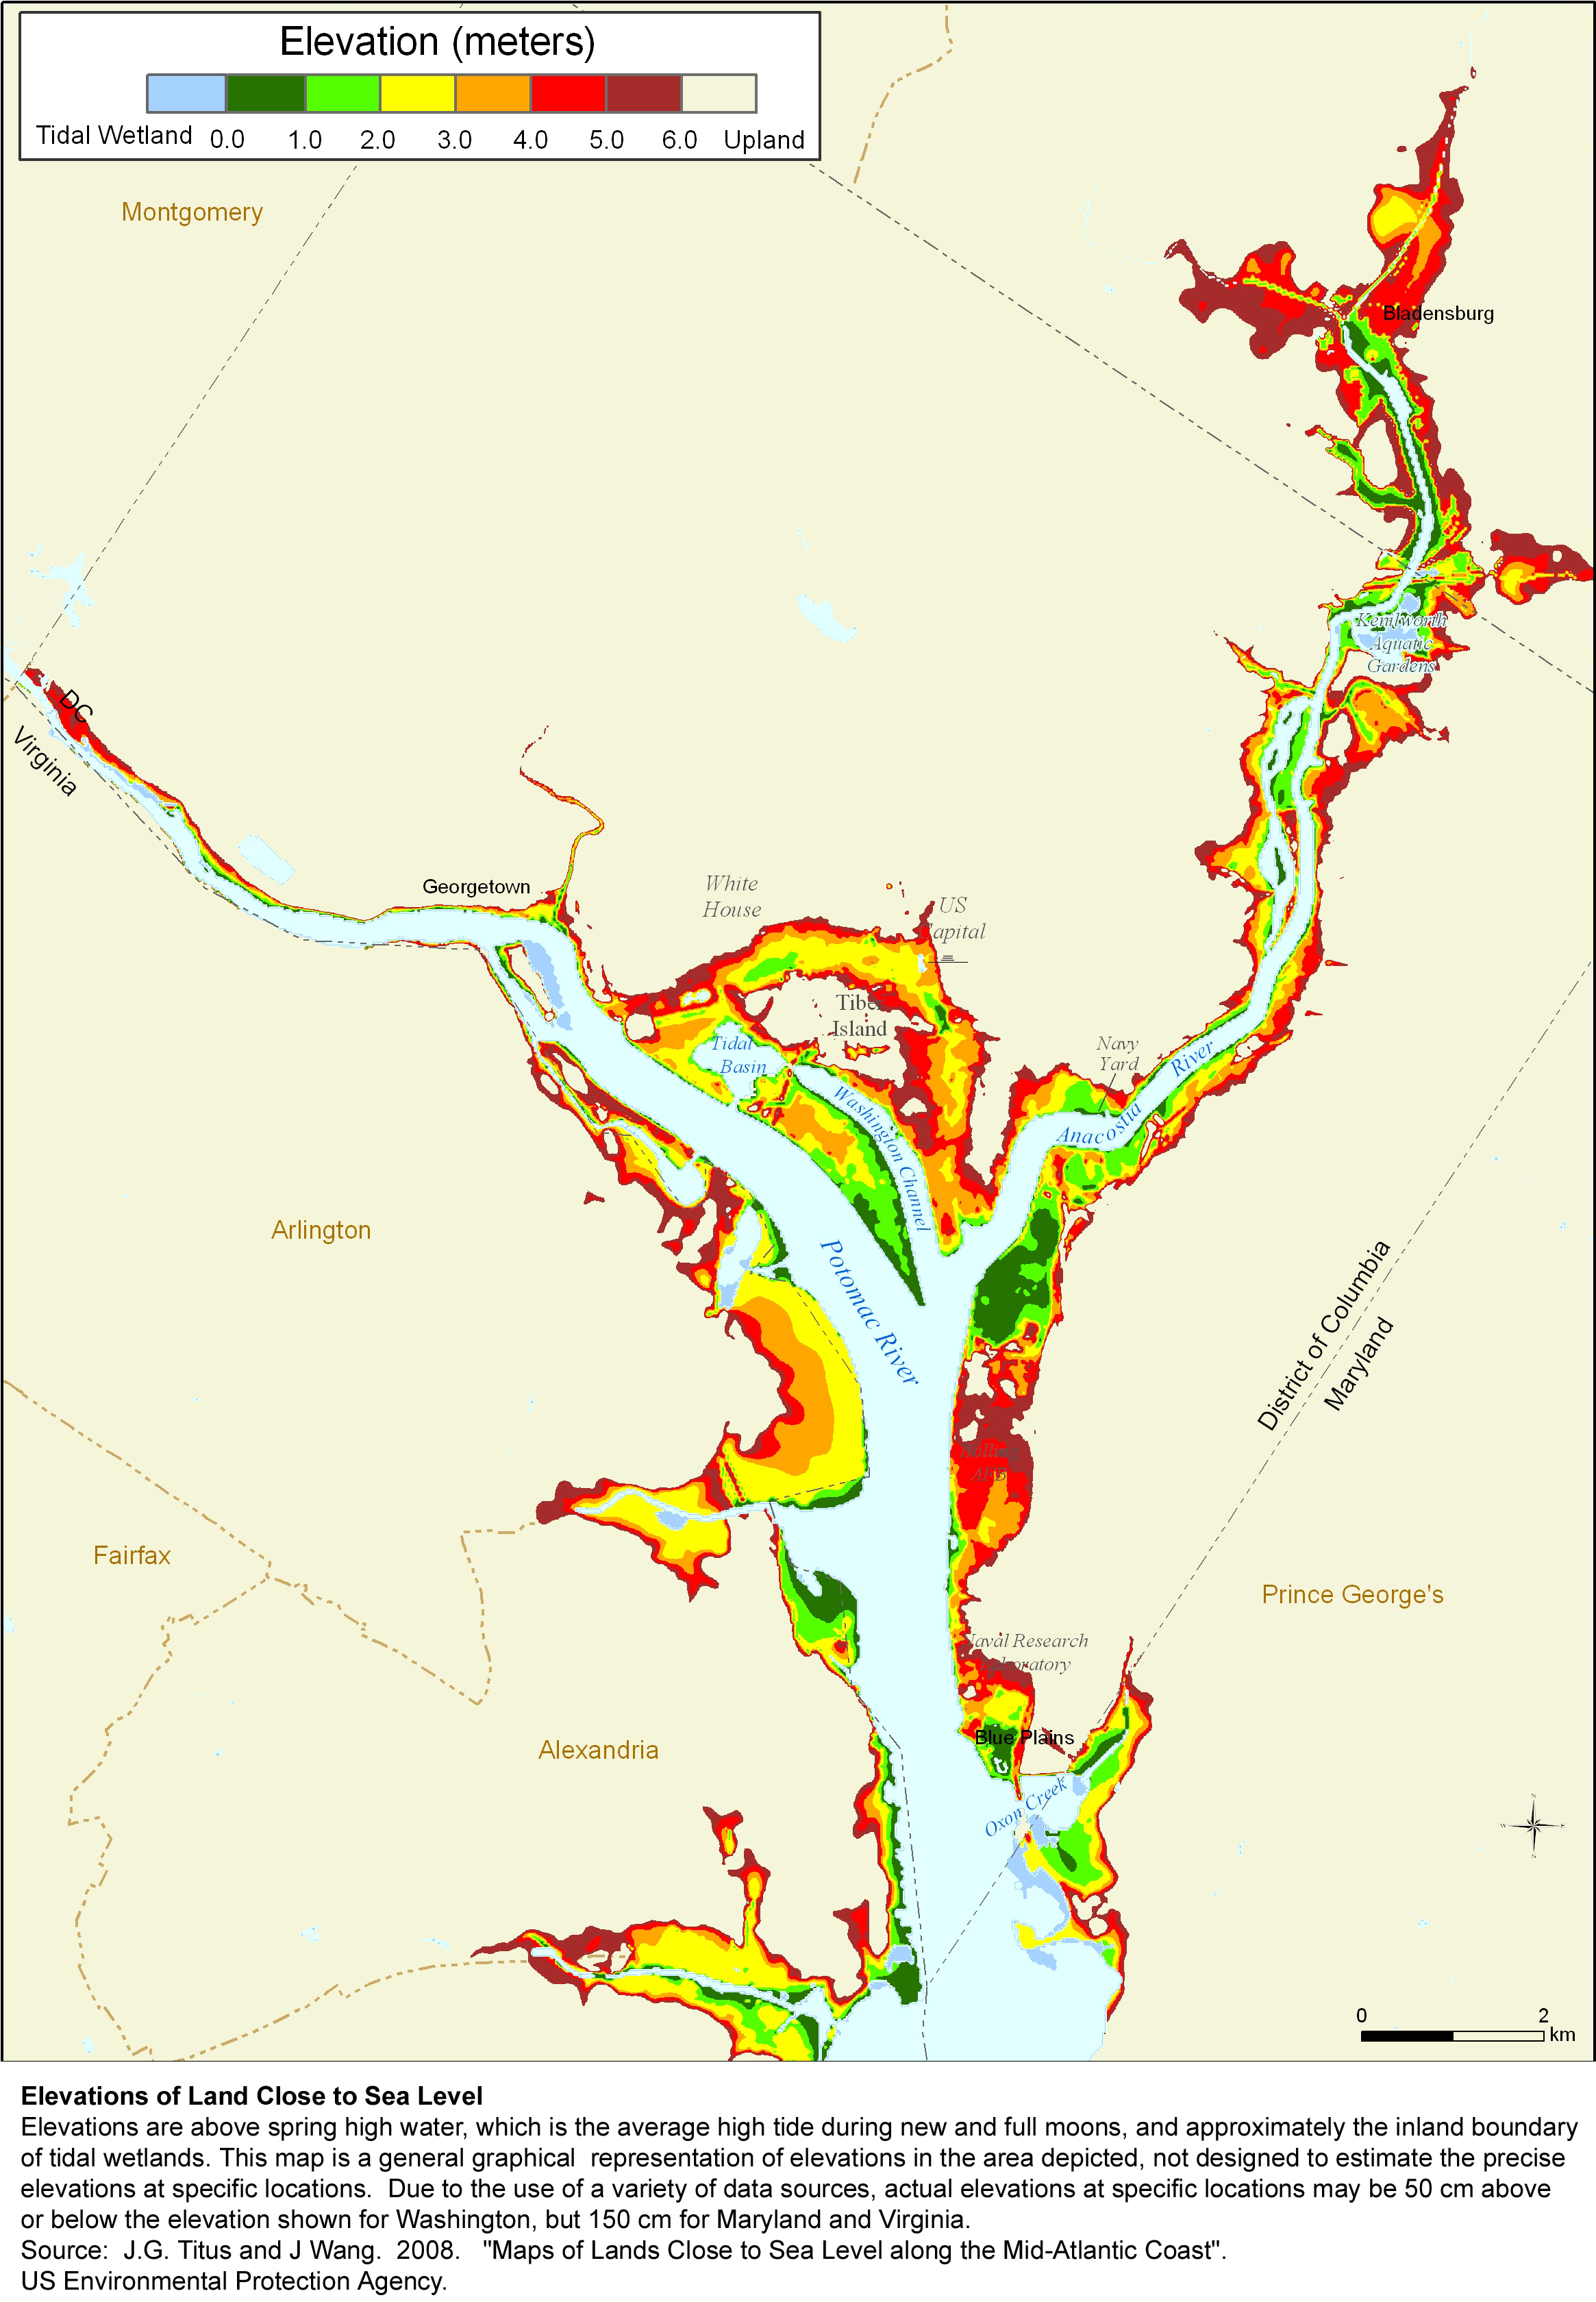
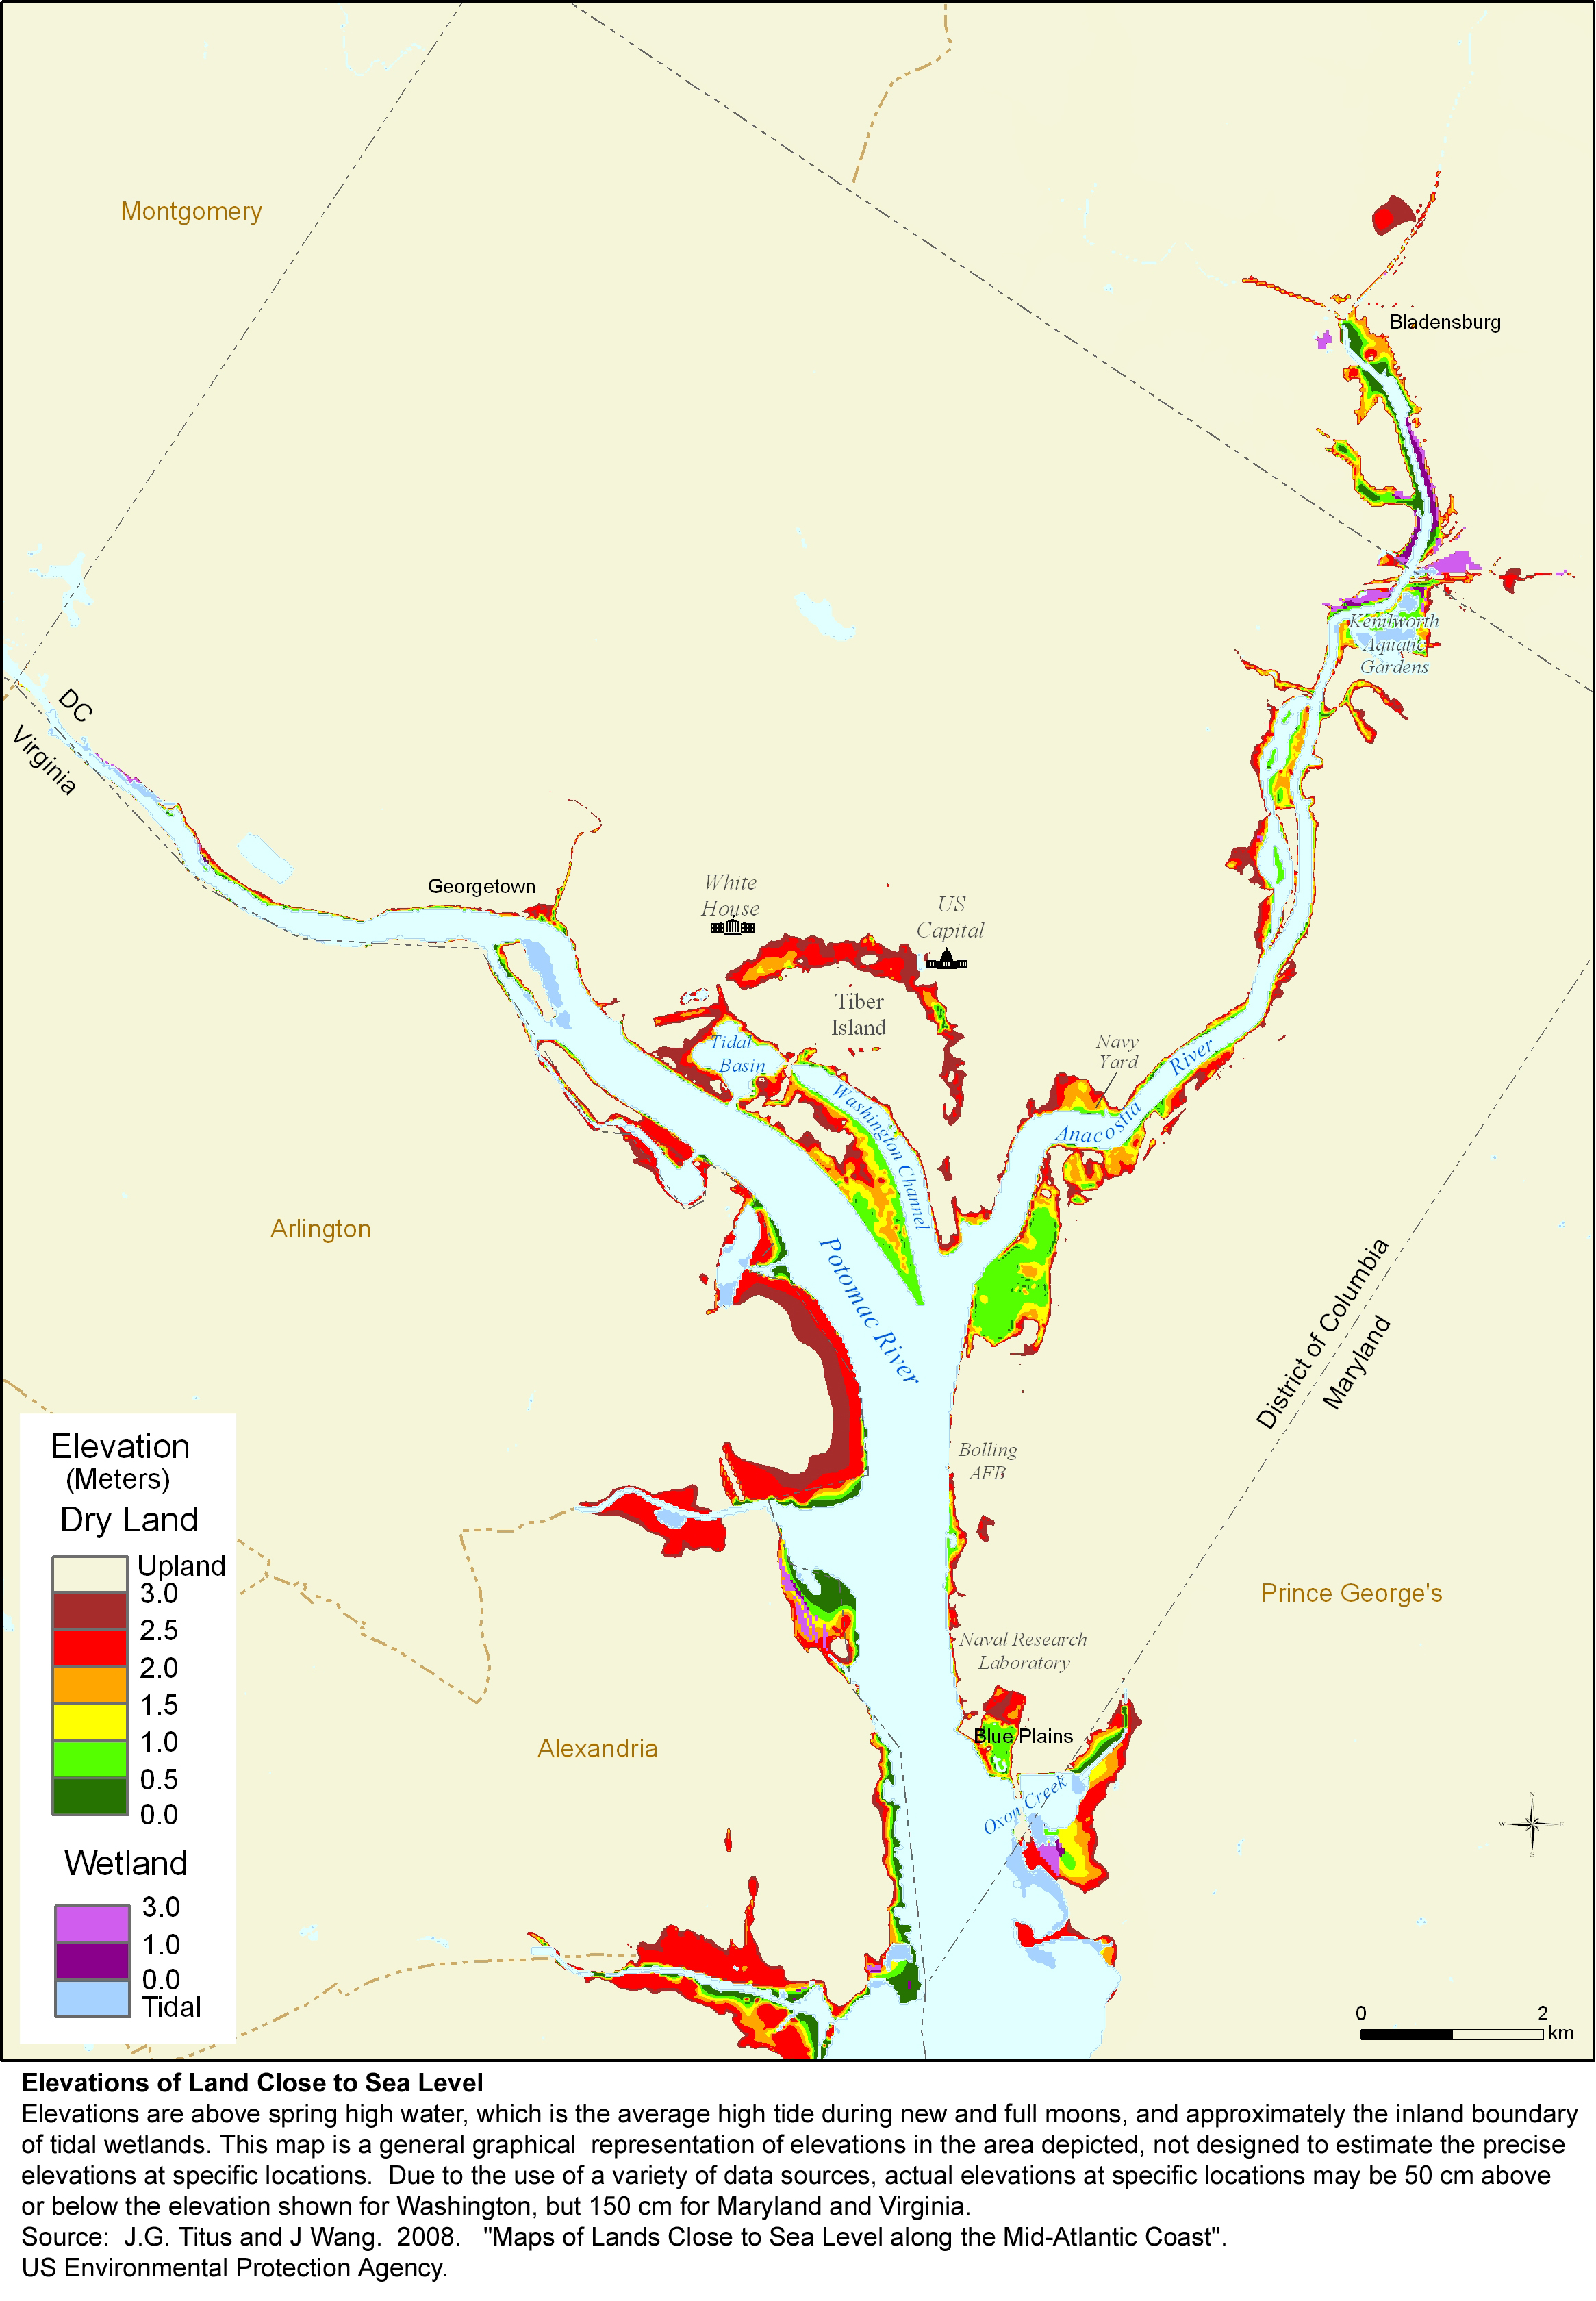
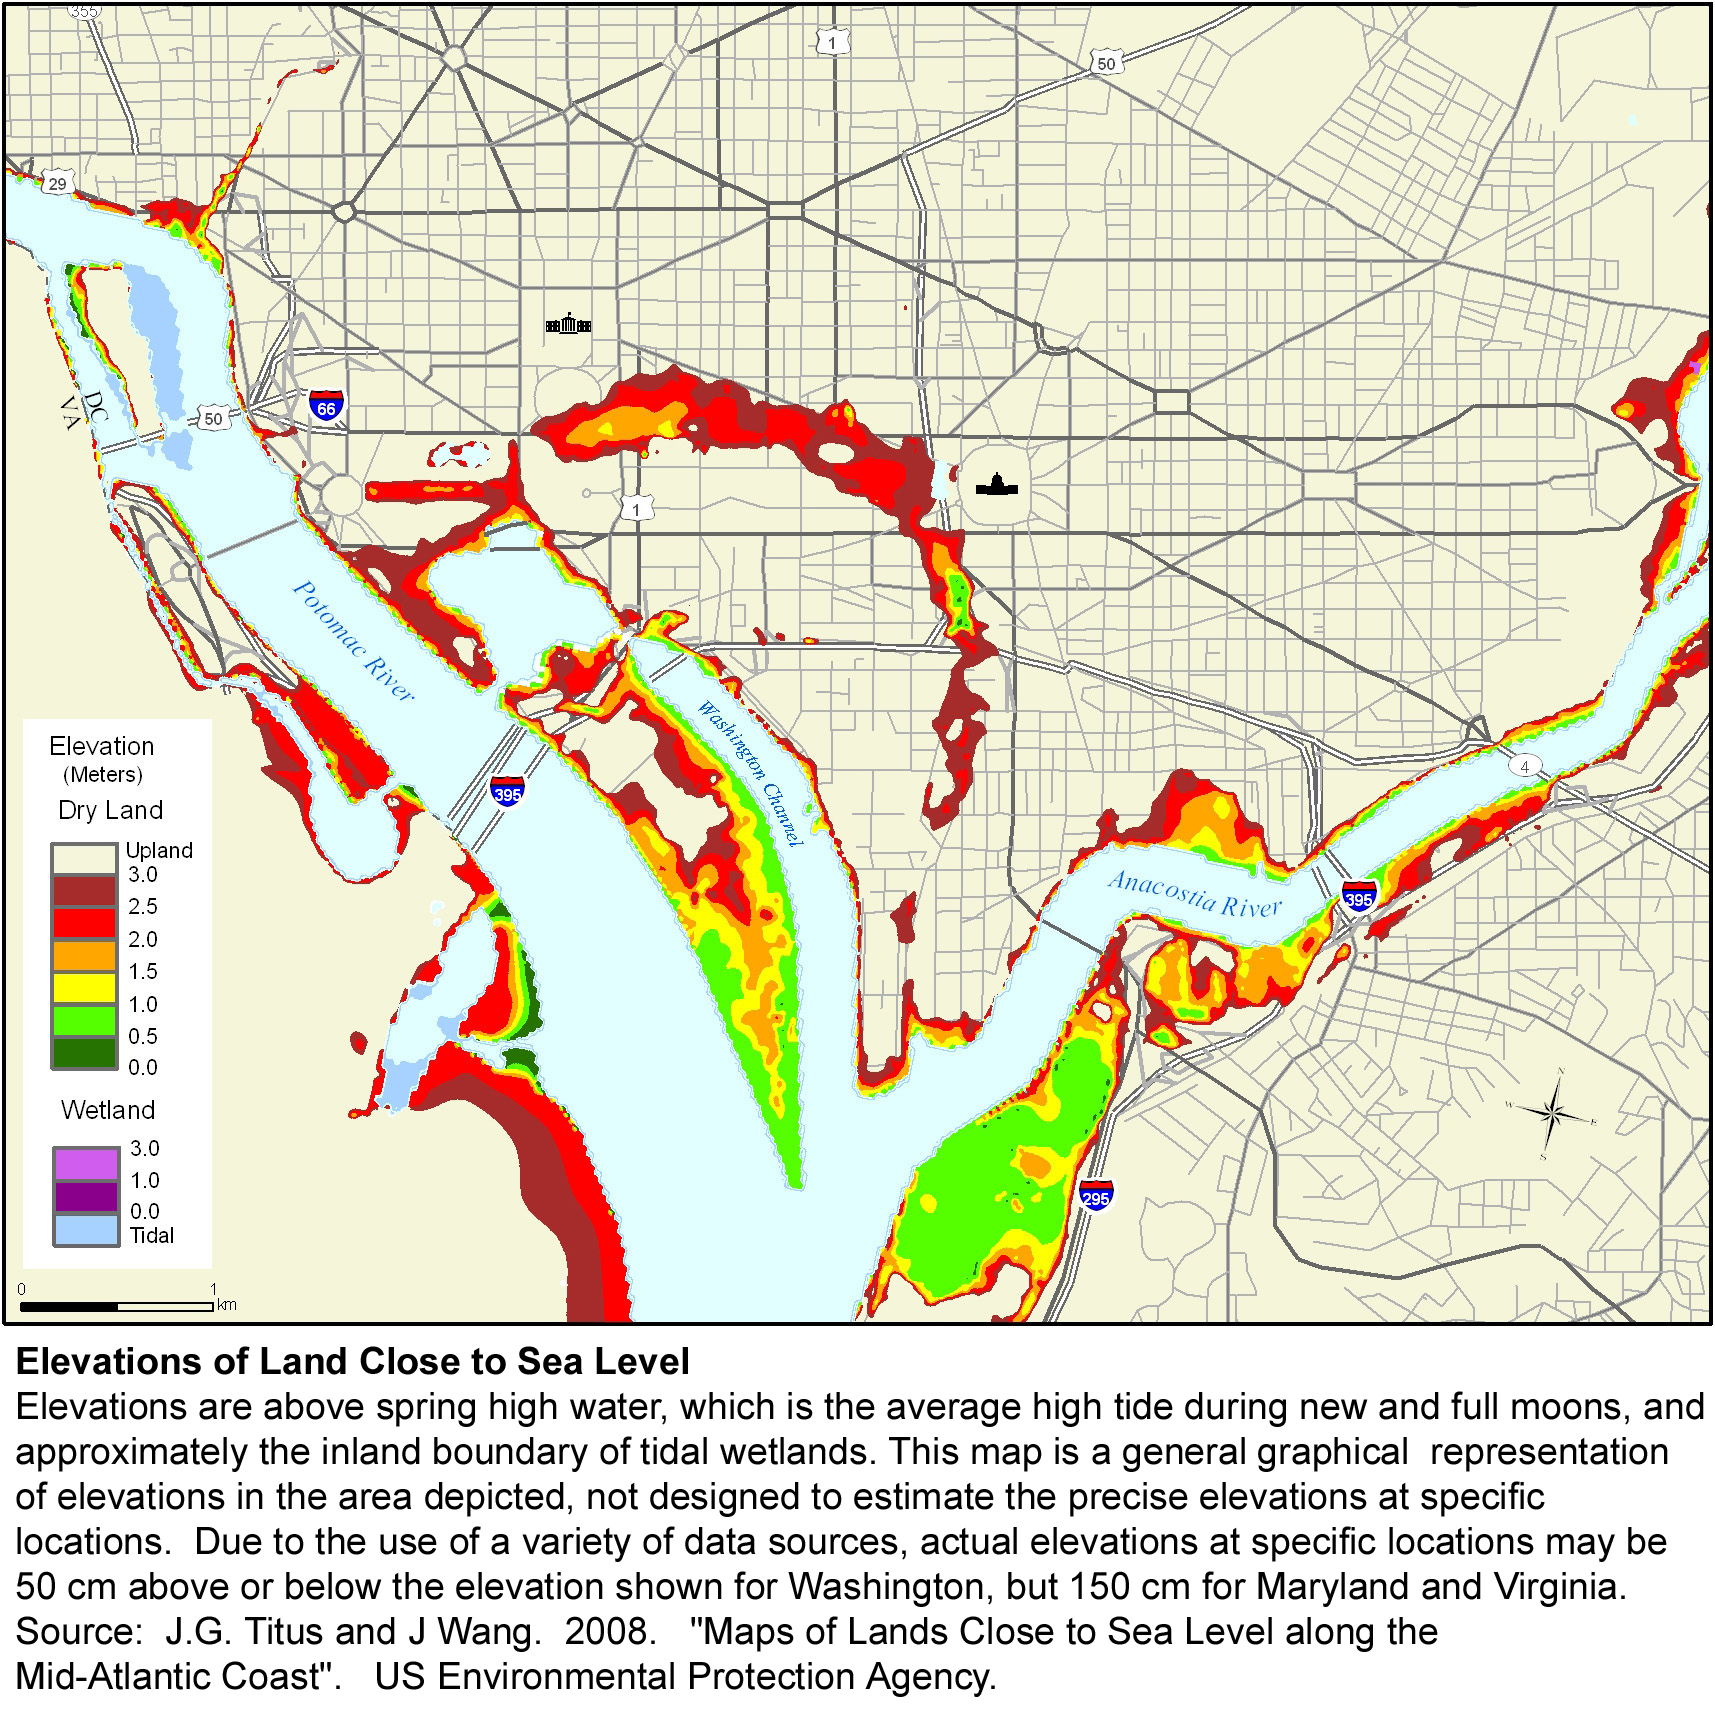
Sea Level Rise Maps for the District of Columbia
Most of these maps are drawn from an EPA study, which developed county-scale elevation
maps to illustrate vulnerability to sea level rise, using data provided by the District's Office of Planning. The maps show elevations
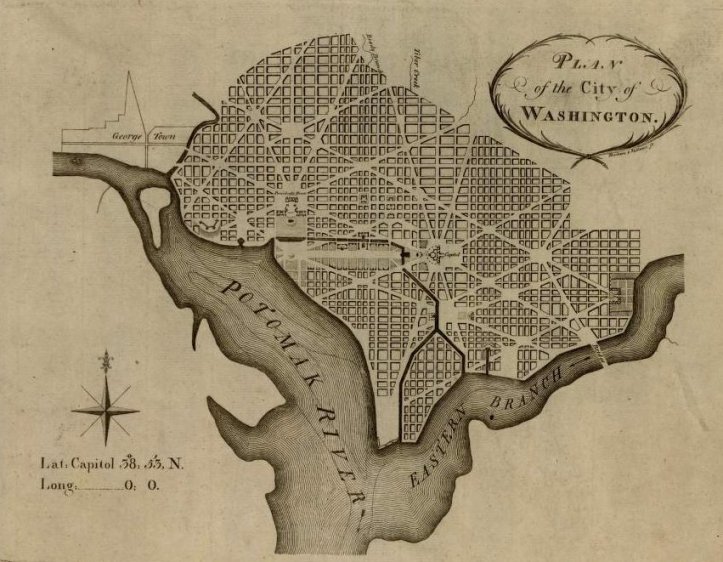
relative to spring high water, the average tide during new and full moons. Comparing L'Enfant's plan
with the current topography shows that most low land in the District was water or wetland during colonial times.
|
|
|
|
|