!

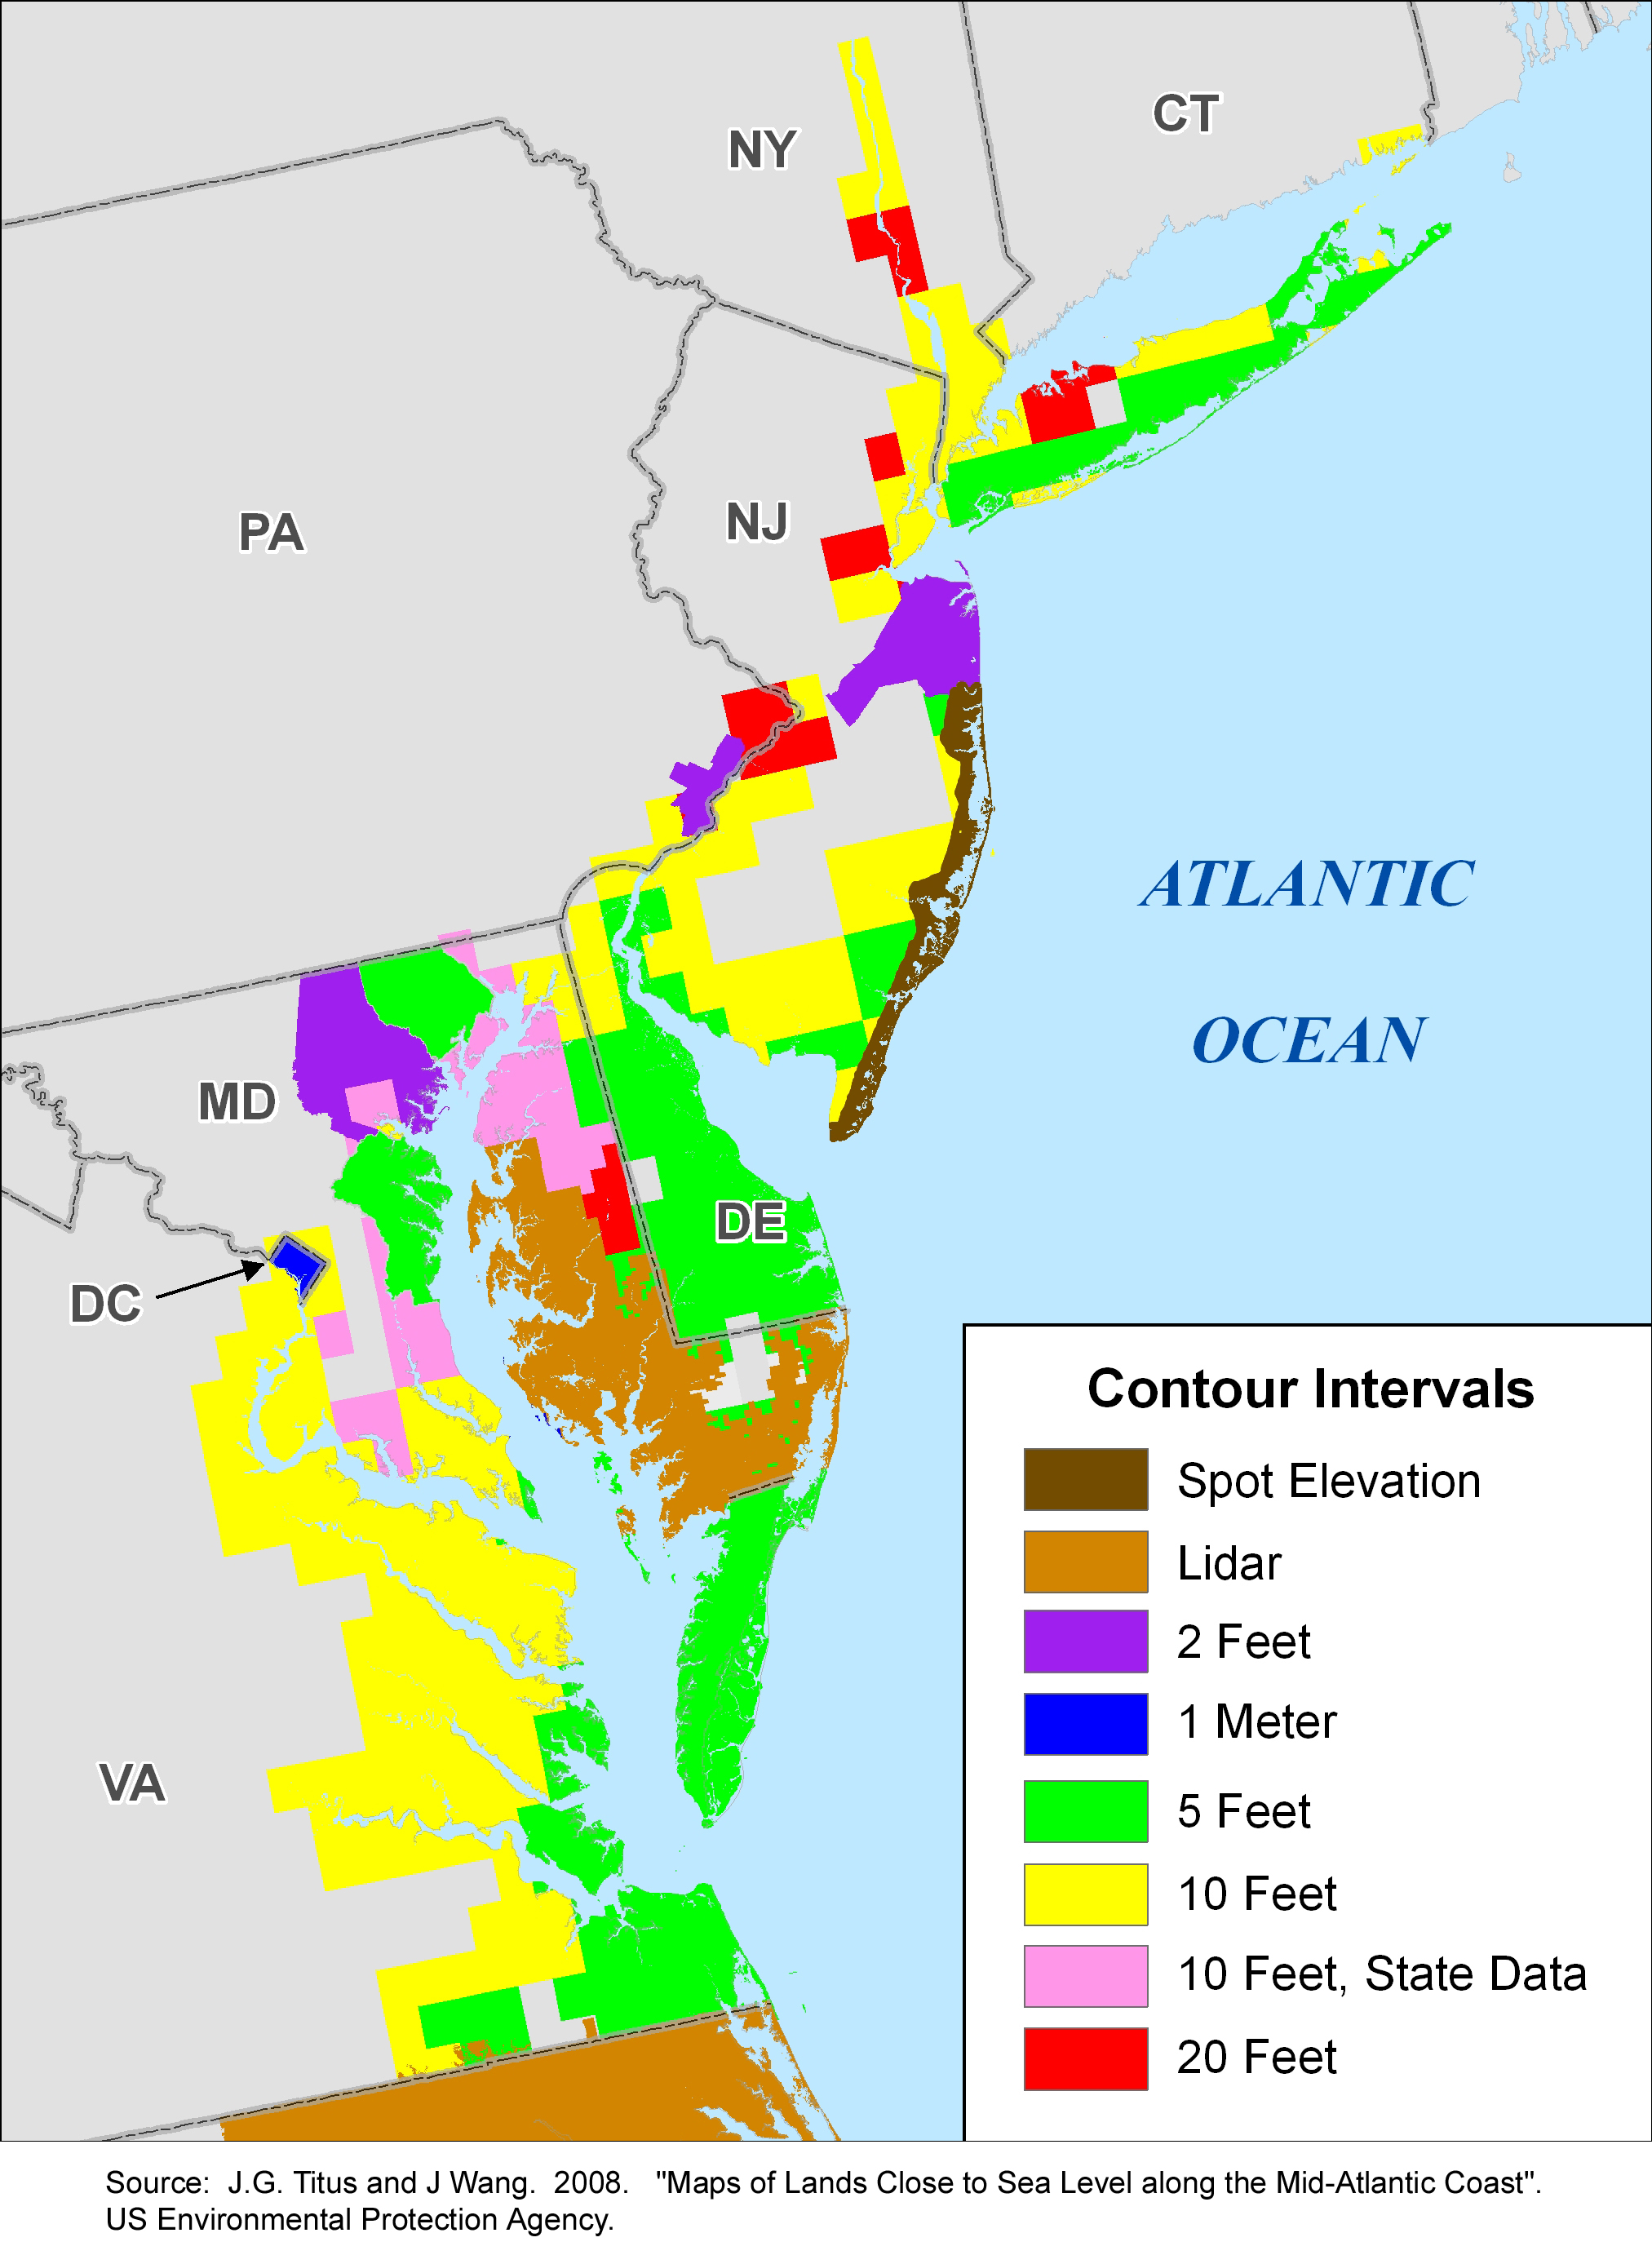
Area of Land Vulnerable to Sea Level Rise: New York to North Carolina

!

The table below provides EPA's estimated uncertainty range of the area of dry land and wetlands below particular elevations, in square kilometers. The uncertainty range considers the varying accuracy of the elevation data that the EPA study used. For example, EPA's estimates that the Pamlico and Albemarle Sounds region has 1186 to 1519 square kilometers within one metet above spring high water, a 30% difference. For the northern New Jersey area around Raritan Bay, by contrast, the uncertainty range is 39 to 117 square kilometers--a 300% difference. LIDAR elevation data is was available to the EPA study for North Carolina; but for Raritan Bay and its tributaries, the EPA study had to rely on USGS topographic maps with 10-foot contours.

The majority of land close to sea level is wetland rather than the dry land, so the bottom half of this table shows the area of tidal and nontidal wetlands vulnerable to sea level rise. A printer-friendly file with the area of dry land and wetland vulnerable to sea level rise in the Mid-Atlantic is also available.


Uncertainty range of the area of land close to sea level, by subregion: Mid-Atlantic1 (square kilometers).
Elevation
Meters above spring high water
0.5
1.0
2.0
3.0
4.0
5.0
Low
High
Low
High
Low
High
Low
High
Low
High
Low
High

— — — Cumulative (total) amount of Dry Land below a given elevation — — —
L.I. Sound/ Peconic
6
31
22
59
63
111
106
158
149
200
190
229
S. Shore Long Island
19
70
59
134
161
250
266
335
347
400
410
450
NY Harbor/
Raritan Bay
5
72
47
143
139
230
215
288
265
343
314
374
New York
0
13
8
25
24
44
40
58
52
72
65
78
New Jersey
5
59
39
117
115
186
175
230
213
271
249
295
New Jersey Shore
18
61
66
129
184
237
262
327
344
409
418
481
Delaware Bay
19
62
52
108
124
206
217
312
321
421
427
512
New Jersey
3
19
15
36
39
73
70
114
109
154
146
182
Delaware
15
43
38
71
85
133
146
198
212
267
281
330
Delaware River
17
80
56
146
152
262
249
368
342
467
430
549
Atlantic Coast of
Del-Mar-Va total
27
87
81
148
200
275
318
390
425
495
529
599
Delaware
11
32
28
53
64
95
104
139
149
187
196
234
Maryland
3
17
20
40
74
97
126
145
165
180
199
211
Virginia
13
37
33
55
62
82
87
106
111
129
134
154
Chesapeake Bay
102
466
441
906
1193
1827
1973
2859
2962
3818
3865
4633
Delaware
1
2
1
3
4
7
9
14
15
24
26
36
Maryland
66
290
306
530
738
1007
1141
1451
1572
1865
1966
2213
District of Columbia
2
3
3
4
5
7
9
11
13
15
16
18
Virginia
34
172
131
369
445
805
815
1383
1362
1915
1857
2366
Virginia Beach
Atlantic Coast
7
27
25
56
78
142
158
219
235
288
293
310
Pamlico Albemarle Sounds
621
1028
1186
1519
2239
2601
3274
3629
4449
4789
5269
5441
Atlantic Coast of
North Carolina
103
151
182
238
370
429
529
579
682
740
855
908
Total NY to NC
945
2136
2218
3585
4903
6569
7567
9463

10520
12370
13001
14486

Elevation

Meters above Spring High Water

0.5
1.0
2.0
3.0
4.0
5.0

Low
High
Low
High
Low
High
Low
High
Low
High
Low
High
Wetlands
Tidal
— — — Cumulative (total) amount of Nontidal Wetlands below a given elevation — —
L.I. Sound/ Peconic
36
1
2
2
4
4
7
7
9
9
11
11
13
S. Shore Long Island
104
1
4
4
7
8
10
11
12
12
13
14
15
NY Harbor/
Raritan Bay
66
0
3
2
6
6
9
9
11
10
13
12
16
New Jersey Shore
399
11
52
42
92
101
157
152
205
196
249
237
286
Delaware Bay
496
16
54
45
90
98
139
140
173
172
202
199
224
Delaware River
216
12
41
33
64
65
93
90
108
103
122
116
133
Atlantic Coast of
Del-Mar-Va total
909
4
14
13
28
39
55
62
73
78
85
89
95
Chesapeake Bay
1750
43
150
143
257
331
483
504
690
714
900
909
1119
Virginia Beach
Atlantic Coast
124
6
21
20
37
42
57
61
73
76
88
89
96
Pamlico Albemarle Sounds
829
2083
2625
2772
3039
3401
3562
3852
3984
4235
4352
4592
4695
Atlantic Coast of
North Carolina
443
197
255
275
315
393
429
495
525
583
616
680
710
Total NY to NC
5372
2374
3221
3351
3940
4487
5001
5381
5864
6189
6652
6948
7401


Cumulative (total) amount of land below a given elevation
Dry land

945
2136
2218
3585
4903
6569
7567
9463
10520
12370
13001
14486
Nontidal wetlands

2374
3221
3351
3940
4487
5001
5381
5864
6189
6652
6948
7401
All land
5372
8691
10729
10942
12898
14762
16943
18321
20699
22081
24394
25321
27260
Sources:
     Uncertainty ranges for the area of  dry land and nontidal wetlands:  Titus, J.G. and Cacela, D.. 2008:
     Single estimate for the area of tidal wetlands:  Titus, J.G. and J. Wang  2008

1. Low and high are an uncertainty range based on the contour interval and/or stated root mean square error (RMSE) of the input elevation data. Calculations assume that half of the RMSE is random error and half is systematic error. For a discussion of these calculations, see the EPA report